
China Is Slowing. The Money Went to What China Controls.

Part 1 set out why China's slowdown looks structural, not cyclical. Part 2 asks a narrower question. If that reading is right, where has the money already gone? The answer is not where most people look. Over the last two and a half years the commodity China buys has gone sideways, and the commodities China controls have repriced by between 60 per cent and nine times. This piece follows that split into the ASX and TSX companies on either side of it, and sets out what each of them has actually reported.

Samso Insights | Macro & Geopolitical | China | Critical Minerals |
READING THE SERIES This piece runs in two parts. Part 1. Sets out the macro case. Japan's precedent, China's property crisis, its debt structure, the population decline and the AI-jobs tension arriving at the same time. Part 2, this piece. Looks at where the capital is actually flowing. The tungsten, tin, copper and iron ore producers on either side of China's role in each market, measured against what they have actually reported. |
A note on the vocabulary and the sources. Technical and mining terms are explained in plain English where they first appear. All of them are also collected in one box near the back, under "The vocabulary, in plain English". Every source carries an identifier, from [R51] onward, continuing the numbering used in Part 1. The identifier appears in the body text at the point the source is used and again at the head of its entry in "References and sources" at the back. Clicking one takes you to the other. Two policies on numbers apply throughout. Where a company's own documents give two different figures for the same thing, this article quotes both as they were published and names the document each came from. It does not attempt to resolve them. Where this article builds a calculation from released data instead of repeating a company statement, it says so at that point and labels it as Samso's own arithmetic. Simple percentage shares worked out from published tonnages are Samso's arithmetic throughout and are not labelled separately each time. Commodity prices and share prices move daily. Every price below carries the date it was observed.
There is a habit in resources investing of treating China as one thing. China slows, commodities fall. China recovers, commodities rise. That reading worked for most of the last twenty years because China's role in almost every commodity market was the same role, which was the buyer.
That is no longer true across the board, and the price record shows it. Iron ore, where China is by far the largest buyer and mines only about a ninth of world output itself, fell about 29 per cent between January 2024 and August 2026, and almost all of that fall came in 2024. Since the start of 2025 it has moved about 3 per cent. Tin has roughly doubled since January 2024. The annual benchmark fee a copper smelter charges a miner has gone to zero, and spot terms have gone below it. Tungsten, where China mines about four-fifths of world supply, has repriced by close to nine times since the start of 2025, which is as far back as a dated price for it can be sourced.
Those are not four different stories about Chinese demand. They are one story about who holds the supply. This article works through it commodity by commodity, then names the ASX and TSX-listed companies that are on the receiving end, and sets out what each of them has actually reported.
WHAT THIS PIECE COVERS 1.00 THE QUESTION PART 1 LEAVES OPEN What the macro case does and does not tell an investor about where to look. 2.00 THE PRICE THAT DID NOT BREAK Iron ore over thirty-one months, and why China's slowdown did not show up in it. Tungsten, tin and copper, and the difference between being a buyer and being a supplier. 4.00 TUNGSTEN AND THE EXPORT LICENCE What China's February 2025 measure actually does, and the one ASX producer with two operating mines. 5.00 TIN AND A SUPPLY BASE THAT HAS NOT COME BACK Myanmar, Indonesia, and a Tasmanian mine that is half owned. 6.00 COPPER SMELTERS WITHOUT CONCENTRATE Why the processing fee went to zero, and a small producer in Oman. 7.00 THE OTHER KIND OF CHINA EXPOSURE A TSX-listed producer where the China link is on the share register, and where the auditor has flagged a going concern uncertainty. 8.00 IRON ORE AND THREE ANSWERS TO ONE PROBLEM What Fortescue, Rio Tinto and BHP are each spending money on. 9.00 WHAT AN INVESTOR IS ACTUALLY BUYING Samso's reading, and what would have to change for it to be wrong. |
1.00 — THE QUESTION PART 1 LEAVES OPEN
A macro case is not a shopping list
Part 1 made an argument about the shape of China's next decade. It did not make an argument about any particular company, and that gap is deliberate. A macro case tells an investor which direction to face. It does not tell them what to own.
The case in short. To the general public, China's property crisis has run since 2021 and is unresolved. Its local government debt is far harder to measure than Japan's ever was. Its population has peaked and its working-age population is falling. Beijing is already legislating against AI-driven job losses while Washington is still debating whether to. Japan took three decades to recover from a similar starting point, and Japan had advantages China does not have.
While the property crisis hit the limelight in 2021, cracks in China's growth were already manifesting in the last decade. While it was not apparent to the mainstream audience, my communication with business associations in China had already told me that things were not going well. The first sign of economic tightness was the demise of the furniture manufacturing sector. There were mass reductions in factories and closures were more common than not. Even in 2025, associates were telling me that Chinese businesses were so competitive that margins were not sustainable. Chinese business was seeking to find markets outside of China to allow them to have margins that made sense.
Suppose all of that is right. An investor still has to answer a second question, which is what any of it means for a listed company in Perth or Toronto. Answering that second question badly is a common way to lose money on a correct macro call.
The method used here was to check the price record first, before choosing a single company or a sector. That produced a different list from the one a search for China-recovery or China-decline beneficiaries would have produced.
2.00 — THE PRICE THAT DID NOT BREAK
Thirty-one months of iron ore
China made 960.8 million tonnes of the world's 1,849.4 million tonnes of crude steel in 2025, which is 52 per cent[R81], and mined about eleven per cent of world usable iron ore output in the same year[R94]. It buys the difference, which makes it the dominant customer in the seaborne market. On a plain reading of Part 1, a China in structural difficulty should show up in the iron ore price before it shows up anywhere else.
It has not, or at least not in the way that reading would predict. The World Bank publishes a monthly average for iron ore fines of 62 per cent iron content delivered to China, which is the benchmark most of the industry quotes[R80]. In January 2024 that average was US$135.82 a dry tonne. In August 2026 it was US$96.30. Between those two points the series never went below US$92.30, which was June 2025, and never went above US$135.82.
FIG. 01 sets that move against three other commodities. It is drawn from the start of 2025 and not from January 2024, because that is the first date on which a dated price can be sourced for all four, and the start and end value of each series is printed beside its bar.

FIG. 01 — Iron ore has fallen slightly since the start of 2025 while copper, tin and tungsten have risen, tungsten by close to nine times. The four are shown as percentage change and not price so they can be read on one scale. Measured from January 2024 instead, iron ore is down about 29 per cent. The start of 2025 is used here because it is the first date all four series can be sourced. Original Samso illustration of sourced data. Iron ore from World Bank monthly averages, copper and tin from London Metal Exchange cash settlements, tungsten from the United States Geological Survey and the China Tungsten Industry Association.
A fall from roughly US$136 to roughly US$96 is a real fall and it should not be dismissed. What it is not is a collapse, and it is not the kind of move a market makes when it decides a structural buyer is in trouble. The Edge Singapore headlined "Iron ore tops US$100 on position unwinds and China buying hopes" on the 7th September 2026[R102]. Although this is only one case, this does feel that a structural demise in iron ore is not a simple process.
China produced 960.8 million tonnes of crude steel in 2025, down 4.4 per cent on 2024, against a world total of 1,849.4 million tonnes [R81]. For January to July 2026 China produced 577.04 million tonnes, down 3.1 per cent on the same period a year earlier[R82]. So Chinese steel output is falling, at roughly three to four per cent a year.
That is a decline, and it is a decline from a very high base. BHP's published view is that the level is the more important number. Section 8.00 sets out BHP's position and where it disagrees with Part 1.
China's slowdown has shown up in iron ore as a soft price. The market has not broken. An investor who bought the iron ore trade as a way of expressing a view on China's economy has, over thirty-one months, been roughly right about the economy and roughly nowhere on the price.
3.00 — THE PRICES THAT DID
What happens when China is the supplier and not the buyer
Three other commodities moved a great deal over the same period, tin and copper from January 2024 and tungsten from January 2025, which is as far back as a dated tungsten price can be sourced. What they have in common is that China's weight in each of them is on the supply side.
Tungsten
Tungsten is a hard, very dense metal used mainly to make cutting tools, drill bits, mining and machining equipment, and armour-piercing ammunition. It is traded in a unit called the metric tonne unit, or mtu, which is ten kilograms of tungsten trioxide content. The most quoted product is ammonium paratungstate, or APT, which is the intermediate chemical that most tungsten metal is made from.
China mined 67,000 tonnes of tungsten content in 2024 and an estimated 67,000 tonnes in 2025, against world totals of 82,000 and 85,000 tonnes[R51]. That is roughly 82 per cent of world mine supply in 2024 and roughly 79 per cent in 2025. China also holds about 2.5 million tonnes of the 4.7 million tonnes of world reserves.
The US Geological Survey records the Rotterdam APT price rising from US$331 a metric tonne unit at the start of 2025 to US$675 by the end of it [R51]. The China Tungsten Industry Association, which publishes a weekly European APT assessment, had that price at US$1,890 to US$1,998 on 6 March 2026 and at US$2,900 to US$3,000 on 31 August 2026[R53]. Fastmarkets, a price reporting agency, assessed APT at US$900 to US$940 in early January 2026 and at US$1,650 to US$1,900 in mid-February 2026[R54].
FIG. 02 plots the APT price across 2025 and 2026 with the February 2025 export measure marked.

FIG. 02 — The European ammonium paratungstate price from January 2025 to the end of August 2026, with the date of China's export licence measure marked. Where a source publishes a range, the midpoint is plotted. Original Samso illustration of sourced data, from the United States Geological Survey, the China Tungsten Industry Association and published Fastmarkets assessments.
Taking the USGS figure at the start of 2025 and the CTIA figure at the end of August 2026, APT has gone from about US$331 to about US$2,950. That is roughly nine times. No verifiable dated APT price is available for calendar 2024, because the USGS publishes only the concentrate series for that year, so the comparison starts in January 2025 and no earlier.
Tin
Tin is used mostly as solder in electronics, and in tinplate and chemicals. China mined 71,000 tonnes of tin content in 2025 and Indonesia 61,000 tonnes, out of a world total of about 290,000 tonnes[R59]. Between them that is roughly 45 per cent of world mine supply. Five Chinese companies alone produced 152,600 tonnes of refined tin in 2025, which is 41 per cent of world refined output of 371,000 tonnes[R60]. That last percentage is Samso's arithmetic on the USGS figures.
The London Metal Exchange cash settlement price for tin was US$25,150 a tonne on 2 January 2024. On 11 September 2026 it was US$53,755[R61]. The 2026 average to the end of August was US$51,355, against US$30,191 for 2024.
Copper
Copper is different again. China mines very little copper, about 1.8 million tonnes in 2025 against a world total of roughly 23 million tonnes, which is about eight per cent [R94]. But China smelts about half of the world's copper. The International Copper Study Group puts Chinese smelter production at 12 million tonnes in 2024, or 51 per cent of the global total, and refined production at 12.4 million tonnes, or 45 per cent[R68].
The International Energy Agency states the same thing in round terms, that China accounts for around 50 per cent of global copper smelting output, up from about 15 per cent in 2005[R69]. The USGS puts Chinese refinery production at 14,000 kilotonnes of a world total of 29,000 kilotonnes in 2025, which is about 48 per cent [R94]. Smelting and refining are different stages and the two shares are not interchangeable.
LME copper cash settlement was US$8,430 a tonne on 2 January 2024 and US$14,238.50 on 11 September 2026[R67]. The 2026 average to the end of August was US$13,301, against US$9,147 for 2024.
FIG. 03 sets China's share of mine supply against its share of smelting for each of these commodities. Each bar carries the year of the figure behind it, because they do not all come from the same year.

FIG. 03 — China's estimated share of world supply in 2025. The two copper bars are the same metal at different stages, mining and refining, and the distance between them is what section 6.00 is about. Original Samso illustration of sourced data, from the United States Geological Survey and the International Copper Study Group. The percentages are Samso's arithmetic on the published tonnages.
So one commodity where China is the buyer has gone sideways to slightly down, and three where China is either the dominant supplier or the dominant processor have gone up by between roughly 60 per cent and roughly nine times.
SAMSO TAKE In my opinion this is the part that most commentary on China gets the wrong way round. The usual framing is that a slowing China is bad for Australian resources, full stop. That framing was built during the period when China's only role in these markets was to buy. It has not been updated for the period we are actually in, where China is also the chokepoint on the way in. What the last two and a half years appear to show is that the market has stopped pricing Chinese demand as the main variable and started pricing Chinese supply as the main variable. Those two things pull in opposite directions for an Australian investor. One of them argues for less exposure and the other argues for more. I am not saying the demand story has gone away. Iron ore is still the biggest export Australia has and China is still the customer. What I am saying is that a portfolio built only on the demand reading is missing the half of the market that has actually repriced. |

4.00 — TUNGSTEN AND THE EXPORT LICENCE
A measure from February 2025 that was never withdrawn
On 4 February 2025 China's Ministry of Commerce and its General Administration of Customs issued Announcement No. 10 of 2025[R52]. It took effect the day it was released. The measure covers tungsten, tellurium, bismuth, molybdenum and indium, and on the tungsten side it covers APT, tungsten oxide, non-controlled tungsten carbide, certain solid tungsten shapes, two tungsten alloy families, and the production technology and data behind them.
The measure requires an exporter to apply to the relevant commercial department for permission before shipping, and approval is granted case by case. There is no stated prohibition in the announcement itself and no country carve-out.
A licence regime and a ban are different things, and the difference shows up in the trade data. Chinese tungsten product exports for January and February 2026 were 1,638.60 tonnes, down 34.33 per cent on the same two months a year earlier, while the value of those exports rose 62.76 per cent [R53]. Less material left China, at a much higher price.
One further measure is an outright ban. On 6 January 2026 the Ministry of Commerce prohibited exports to Japan of dual-use items destined for military end use, expressly including APT, tungsten oxide and tungsten carbide. That was reported by Fastmarkets on 9 January 2026 [R54].
The reason to separate these two is that most of China's October 2025 export control package, including the extraterritorial rule on rare earth magnets, was suspended until 10 November 2026 following the Busan meeting between the two presidents. The February 2025 tungsten licence was not suspended. It is the standing regime[R95].
WHAT A METRIC TONNE UNIT IS Tungsten is priced in metric tonne units, written mtu. One mtu is ten kilograms of tungsten trioxide, WO₃, contained in the material being sold. So a price of US$3,000 per mtu is a price for ten kilograms of contained tungsten trioxide, not for a tonne of anything. A concentrate grading 65 per cent WO₃ contains 65 mtu in every tonne. Company production figures in this section are quoted in mtu because that is how the companies report them. The APT price in FIG. 02 and the realised price a producer reports are both quoted per mtu, and they are not the same thing. APT is a refined chemical. A mine sells concentrate, which is paid on its contained tungsten trioxide at a discount to the APT price and usually on a lagged pricing period. So a producer realising less per mtu than the APT assessment of the same week is normal, and the gap is not a shortfall against the market. |
THE OTHER EXPLANATION FOR THE TUNGSTEN PRICE Supply is not the only thing that could move tungsten nine times in twenty months. Tungsten goes into armour-piercing ammunition and into the machine tools that make almost everything else, and European and Asian defence budgets have been rising through the same period. A demand shock and a supply restriction would both produce the chart in FIG. 02. The difference matters to an investor because the two causes behave differently. A price held up by consumption lasts as long as the consumption does. A price held up by a restriction on supply lasts as long as the restriction does, and it can be undone by a change of policy that arrives without warning. Two things in the record point at supply as the larger part. The first is the shape of the export data. Chinese tungsten product exports for January and February 2026 were 1,638.60 tonnes, down 34.33 per cent on the same two months a year earlier, while the value of those exports rose 62.76 per cent [R53]. Set one against the other and the average price of a tonne of exported Chinese tungsten rose to roughly two and a half times its level a year earlier. That is Samso's arithmetic on the association's figures. Less material left China and buyers paid far more for what did leave. A demand boom on its own would not usually produce that. A higher price is an incentive to sell more, so a producer facing a surge in orders and no restriction would be expected to ship more tonnes, not fewer. The second is the gap between the price inside China and the price outside it, and the way that gap has widened. At the end of March 2026 the two were close. Chinese domestic APT was about RMB 1.48 million a tonne, renminbi being China's currency. European APT was US$2,800 to US$3,150 per mtu, which the China Tungsten Industry Association converts to RMB 1.713 million to RMB 1.927 million a tonne[R99]. The seaborne price stood above the domestic one by something like a sixth to a third. That is Samso's arithmetic on the association's published figures. Five months later they had come apart. At the end of August 2026 Chinese domestic APT was about RMB 600,000 a tonne, and European APT was US$2,900 to US$3,000 per mtu, which the same association converts to RMB 1.725 million to RMB 1.785 million a tonne[R100]. The seaborne price had barely moved over those five months, while the Chinese domestic price had fallen by about sixty per cent. Chinese high-grade tungsten concentrate fell on the same path, from above RMB 1 million a standard tonne in early March to about RMB 415,000 to RMB 420,000 at the end of August [R99][R100]. In a single connected market a gap of that size does not usually last. Material moves from the cheap side to the expensive side until the difference is no more than the cost of shipping it. A gap of roughly three times, held for months, is the mark of a market that material cannot move freely across. That is an argument about which cause is larger. It is not a claim that defence demand plays no part, and Samso has not seen a source that separates the two. |
FIG. 04 draws the two prices side by side at the two dates. The seaborne bar is the European assessment converted into renminbi by the association that publishes both series, so the two are on the same footing.
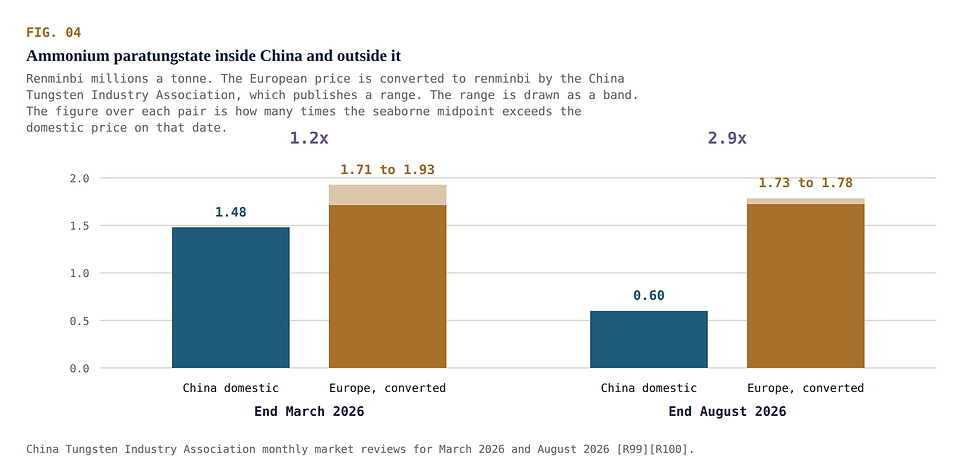
FIG. 04 — Ammonium paratungstate inside China and outside it, at the end of March 2026 and the end of August 2026. The European price is converted into renminbi by the same association that publishes both series, and the band on each seaborne bar is the range it publishes. Original Samso illustration of sourced data, from the China Tungsten Industry Association monthly market reviews for March 2026 and August 2026.
EQ Resources (ASX: EQR)
EQ Resources Limited is the ASX-listed tungsten producer with two operating mines[R55]. Mt Carbine is in North Queensland, inland and north-west of Cairns, and is wholly owned. Barruecopardo is in Salamanca Province in Spain, held through a wholly owned subsidiary and acquired in January 2024. A third Queensland asset, Wolfram Camp, is at mining lease application and drilling stage and is not producing.
FIG. 05 shows where the two mines are.

FIG. 05 — The locations of EQ Resources' two operating mines. Mt Carbine is inland from Port Douglas and Cairns in North Queensland. Barruecopardo is in Salamanca Province in western Spain, near the Portuguese border. Other tungsten operations in each district are marked with their owners. Company maps reproduced from EQ Resources Limited, Investor Presentation, 14 July 2026, slide 8, with attribution [R96]. Two panels of that slide are shown side by side, and the accompanying photographs and data tables are not reproduced here.
The company's reported numbers over the last five quarters show the price move arriving in a profit and loss account.
For the March 2026 quarter EQR produced 23,505 mtu of tungsten trioxide across the two mines, sold 23,592 mtu, and realised an average price of US$962 per mtu sold, at a nominal cash cost of US$572 per mtu sold [R55]. For the June 2026 quarter it produced 28,315 mtu and realised an average of US$1,875 per mtu at a cost of US$711 per mtu. The realised price nearly doubled in one quarter. FIG. 06 sets those two quarters side by side.

FIG. 06 — EQ Resources' realised tungsten price against its reported nominal cash cost, for the two most recent reported quarters, on a group basis covering both mines. Original Samso illustration of data reported by EQ Resources in its quarterly activities reports for the March and June 2026 quarters.

PLATE 01 — The northern area of the Barruecopardo open pit and its temporary sump, with mining under way on Phase 6 at 645 metres elevation. The photograph was taken on 8 July 2026, days after the operation regained access to the flooded southern pit. Photograph reproduced from EQ Resources Limited, Quarterly Activities Report for the quarter ended 30 June 2026, page 4, with attribution [R55].
PLATE 01 is the company's photograph of the Barruecopardo pit in early July 2026, taken as the operation returned to full production after flooding earlier in the year.
The revenue line follows. EQR reported statutory revenue of A$66,082,006 for the year ended 30 June 2025, with a loss after tax of A$39,307,079[R56]. For the half year ended 31 December 2025 it reported revenue of A$43,958,030 and a loss after tax of A$6,964,961. For the June 2026 quarter alone it reported revenue of about A$79 million [R55].
August 2026 was stronger again. For that single month the company reported A$55.1 million of revenue on group production of 19,068 mtu and group sales of 17,246 mtu, at an average realised price of US$2,269 per mtu[R57]. That is the second highest monthly production the company has recorded, behind 20,838 mtu in September 2024, and it is a realised price about 21 per cent above the June quarter's US$1,875. The release carries the company's own footnote that the figures are subject to final assays and reconciliation, and it was issued on the authority of the board by Craig Bradshaw, Managing Director.
Several counterweights stand beside those figures.
The quarterly and monthly revenue figures are unaudited. The June quarter carries the company's footnote that year-end procedures identified an administrative error in invoices to a specific customer, with the potential to increase revenue by US$12.2 million. The audited full-year result for the year ended 30 June 2026 had not been published as at 15 September 2026, so no audited figure yet covers the ramp-up.
There is also a regulatory matter in Spain. On 10 July 2026 the Territorial Service of Industry, Commerce and Economy of Salamanca issued a notice of partial non-compliance with the restoration mining plan at Barruecopardo, relating to water management. Operations continued and the company assessed the risk of temporary suspension as low [R55].
There is also a discrepancy in the company's published resource figures, and Samso's policy is to state it and leave it there.
Mineral Resources and Ore Reserves reported by ASX companies are governed by the JORC Code, which requires a stated effective date and a named Competent Person, so a figure quoted without one is not a JORC statement. On that test the company's published resource figures do not agree with each other. TABLE 01 sets out what each document says.
TABLE 01 — EQ Resources Mineral Resource figures as published in each document. Every figure is quoted as released and none is reconciled here. Compiled by Samso from the documents named in the last column.
Asset | Tonnes | Grade | Effective date given | Document |
Mt Carbine | 41.4 Mt | 0.23% WO₃ | None | Investor Presentation, 14 July 2026, footnoted to the 2025 Annual Report |
Mt Carbine | 41.70 Mt | 0.23% WO₃ | 30 June 2024 | Most recent figure carrying a stated date |
Barruecopardo | 22.9 Mt | 0.20% | None | Investor Presentation, 14 July 2026, slide 8 |
Barruecopardo | 21.49 Mt | Not stated | None | Investor Presentation, 14 July 2026, slide 14 |
Barruecopardo | 24.37 Mt | 0.195% | 9 November 2023 | Most recent figure carrying a stated date |
Both presentation figures are footnoted to the 2025 Annual Report [R96], and that Annual Report contains Ore Reserve tables and no Mineral Resource table [R56]. Slide 8 and slide 14 of the same deck also disagree with each other. All of it is quoted as published, and resolving the difference belongs to the company.
The Ore Reserve position is clearer. Mt Carbine carried a Probable Ore Reserve of 14.80 Mt at 0.147 per cent WO₃ for 2,178,765 mtu at 30 June 2025 [R56]. Barruecopardo carried Proved and Probable Ore Reserves of 13.87 Mt at 0.136 per cent for 1,890,888 mtu effective 30 June 2025, a 39 per cent increase on the previous statement, estimated independently by Mining Sense Global SL at a US$450 per mtu price assumption[R58]. The realised price in the June 2026 quarter was US$1,875 per mtu, against that US$450 assumption.
Ownership is simple at the project level and carries obligations at the sales level. EQR consolidated Mt Carbine to 100 per cent in July 2024 by acquiring CRONIMET's remaining 50 per cent of the retreatment joint venture, and in doing so assumed obligations under an offtake agreement covering 25,000 tonnes of tungsten concentrate [R56]. CRONIMET retains a marketing role for Barruecopardo production and takes a 1 per cent net marketing fee over five years, which is a direct deduction from the Spanish operation's proceeds. A five-year offtake with Elmet Technologies LLC was executed in November 2024. A prepayment facility of A$25 million with Traxys was opened in the March 2026 quarter [R55].
The company also has an expansion at Mt Carbine costing A$39 million, approved on 3 June 2026, which is intended to take crushing capacity from about 1 million tonnes a year to about 2 million, with full plant acceptance targeted for March 2027 [R55]. Cash on hand was A$28.0 million at 30 June 2026, against A$1.87 million at 30 June 2025.
On 15 September 2026 EQR signed a binding agreement to take 10 per cent of a processing joint venture over the Springer Tungsten Complex in Nevada [R103]. The Elmet Group holds 70 per cent and operates it, and Blue Moon Metals holds 20 per cent and retains the mine and mill. The complex carries a 1,200 tonne per day mill and an APT plant designed for 4,000 tonnes a year. The package runs to between US$150 million and US$175 million, with Elmet contributing US$150 million and a further US$25 million standby facility supporting the restart.
EQR has committed 4,000 tonnes of contained tungsten trioxide over eight years from commissioning, and takes 25 per cent of plant input capacity for the first five years, capped at 1,000 tonnes a year, falling to 10 per cent after that. APT is the point where China's February 2025 licence regime applies, and the Springer plant is designed to make APT in the United States with the US Department of War as sponsor. The mine and mill restart is targeted for the December 2027 quarter and the APT plant for the second half of 2028. Those are the company's targets and neither is built.
5.00 — TIN AND A SUPPLY BASE THAT HAS NOT COME BACK
Myanmar, Indonesia and a Tasmanian mine that is half owned
The tin price has roughly doubled since the start of 2024 and the reason appears to be principally on the supply side.
Myanmar is the clearest case. The Man Maw mining district in Wa State was described by the International Tin Association as about ten per cent of world tin concentrate supply, and mining there was suspended from 1 August 2023[R62]. A partial resumption in January 2024 specifically excluded tin. In February 2024 the Wa authorities imposed a 30 per cent tax in kind on tin concentrate exports while the suspension stayed in place. The ban was lifted in March 2025, and restart has been slow.
Contained tin output ran at about 630 tonnes a month from May to October 2025 and about 1,300 tonnes a month in November and December 2025. In February 2026 the authorities added a 5 per cent fee on concentrate from initial ore batches to cover dewatering costs, on top of the existing 30 per cent tax in kind [R62].
The USGS numbers show the result. Myanmar produced 20,000 tonnes of tin content in 2024 and an estimated 12,000 tonnes in 2025, a fall of 40 per cent [R59].
Indonesia has had its own disruption. A change in the export licensing regime in early 2024 left January 2024 Indonesian tin exports at 400 kilograms, a fall of about 99 per cent on January 2023, with only one company confirmed as approved [R62]. In October 2025 the Indonesian president formally handed six confiscated tin smelters, roughly half the country's refined capacity, to the state-owned producer PT Timah.
Globally, refined tin production was 371,000 tonnes in 2025 against consumption of 389,000 tonnes, so the market ran an 18,000 tonne deficit, up 126 per cent on the 8,000 tonne deficit in 2024 [R60]. Excluding China, the balance flipped from a 2,100 tonne surplus in 2024 to a 6,700 tonne deficit in 2025.
FIG. 07 plots the LME tin price with the Myanmar restart marked.

FIG. 07 — London Metal Exchange tin, cash settlement, at selected dates from January 2024 to September 2026. The marker is the month the Wa State authorities lifted the Man Maw mining ban. Original Samso illustration of sourced data, from London Metal Exchange official cash settlement prices.
Metals X (ASX: MLX)
Metals X Limited holds a 50 per cent participating interest in the Renison tin operation in Tasmania, 15 kilometres north-east of Zeehan on the west coast[R64]. Metals X publishes Renison production figures on a 100 per cent basis, so its own share of any production number is half of the figure the quarterly report shows. The other 50 per cent is held by YT Parksong Australia Holdings Pty Ltd, which traces up through Yunnan Tin Hong Kong to Greentech Technology International Limited and Yunnan Tin Group.
Greentech's Hong Kong listing was cancelled with effect from 24 August 2026 [R64]. Metals X separately holds about 3.11 per cent of Greentech, an investment it remeasured to nil at 31 December 2025 for want of observable market evidence of a recoverable value.
FIG. 08 shows the Renison locality and the surrounding tenements. PLATE 02 shows the underground workings, which is where the ore comes from.

FIG. 08 — The Renison tin operation on the west coast of Tasmania, with the Federal and Argent faults, the Ringrose deposit and the surrounding exploration licences marked. The inset locates Renison between Zeehan and Burnie. Company map reproduced from Metals X Limited, 2026 Annual General Meeting Presentation, 19 May 2026, slide 11, with attribution [R97]. Map panel only. The accompanying text panel is not shown.

PLATE 02 — Underground development at Renison. Metals X presents this photograph on the slide describing the Renison tin operation. Renison is an underground mine, so the ore in the piece comes from workings like these and not from an open pit. Photograph reproduced from Metals X Limited, 2026 Annual General Meeting Presentation, 19 May 2026, slide 10, with attribution [R97].
Renison produced 2,809 tonnes of tin in concentrate in the June 2026 quarter on a 100 per cent basis, of which Metals X's share was 1,405 tonnes[R63]. Ore milled was 183,755 tonnes at 1.95 per cent tin with a mill recovery of 78.55 per cent. C1 cash cost was A$20,251 a tonne of tin and all-in sustaining cost was A$34,865 a tonne.
Statutory revenue was A$204,729,000 for the half year ended 30 June 2026, up 38.76 per cent on the previous corresponding half, with profit after tax of A$103,905,000 [R64]. Metals X has a 31 December year end, so that is a half year. For the year ended 31 December 2025 revenue was A$284,999,000 with profit after tax of A$104,605,000[R65]. Metals X reports its pricing against the LME three-month price and not the cash settlement used elsewhere in this piece. On that basis the average over the June 2026 half was US$50,453 a tonne against US$32,194 in the previous corresponding half.
THE NUMBER AN INVESTOR SHOULD NOT USE Metals X publishes a figure it calls "imputed revenue", which for the June 2026 quarter was A$207.40 million. That is not Metals X revenue. It is a notional 100 per cent-of-Renison figure, calculated as the imputed LME tin price applied to an assumption that all quarterly production was sold and paid for by quarter end. Metals X's own 50 per cent share of imputed revenue for that quarter was A$103.70 million [R63]. Imputed EBITDA and imputed net cash flow are constructed the same way. Quoting A$207.4 million as the company's quarterly revenue would overstate it by a factor of two. The statutory figures are A$204.7 million for the half year to 30 June 2026 and A$285.0 million for the year to 31 December 2025. |
Cash and cash equivalents were A$374.00 million at 30 June 2026, up A$14.92 million in the quarter after paying A$28.14 million of income tax and investing A$17.54 million in Stellar Resources and A$2.07 million in Tanami Gold [R63]. About A$285 million of that was in short-term deposits at roughly 4.85 per cent. The company describes itself as debt-free.
Metals X has also been buying positions in other listed resource companies. It holds 29.95 per cent of the tin developers First Tin Plc, 16.39 per cent of Stellar Resources and 15.91 per cent of Elementos, and 7.43 per cent of the nickel and cobalt company NICO Resources, alongside A$36.00 million of Cyprium Metals convertible notes [R63].
On reserves, the 2025 Renison Ore Reserve update gave Proved and Probable reserves of 7.505 Mt at 1.37 per cent tin for 102,700 tonnes of contained tin, reported on a 100 per cent basis, of which Metals X's share is half, effective 31 March 2025, down 8.5 per cent in contained tin year on year [R63]. The 2026 Mineral Resource update, released on 29 June 2026 and using data to 31 March 2026, gave a total of 49.3 Mt at 0.85 per cent tin for 419,600 tonnes contained, on a 100 per cent basis[R66]. That total is two different things added together. Renison Bell, the underground mine, is 21.8 Mt at 1.38 per cent tin for 300,300 tonnes of contained tin. Rentails, the tailings retreatment resource, is 27.5 Mt at 0.43 per cent tin for 119,000 tonnes and is unchanged from the 2024 statement. The blended 0.85 per cent should not be read as a mine grade.
“Renison is a world class tin deposit and Australia’s largest primary tin producer. The results from the 2026 Mineral Resource represent the ongoing definition and resource drilling and updated modelling assumptions. We have again been able to more than replenish what we have mined. This was achieved in spite of limited access to drilling platforms in the A5 and Leatherwood areas.”
Brett Smith, Executive Director, Metals X Limited, ASX release of 29 June 2026 [R66]
Two things in that statement are worth separating. Replenishing what has been mined is a claim the numbers support, since Measured and Indicated tin tonnes rose 7 per cent to 264,100 tonnes while Inferred tonnes fell 19 per cent to 36,000 tonnes [R66]. The limited access to drilling platforms is the company naming its own constraint, and it says the platforms are in this year's budget. Neither statement is a reserve, and the Ore Reserve update is the thing to wait for.
There is currently no published Rentails Ore Reserve. Metals X withdrew it on 2 April 2024 pending completion of a definitive feasibility study update, stating at the time that a material change was not anticipated [R66]. Rentails requires unanimous joint venture approval for a final investment decision, expected in calendar 2027. An updated Renison life-of-mine plan and Ore Reserve were expected in the third quarter of calendar 2026 and had not been published as at 7 September 2026.
6.00 — COPPER SMELTERS WITHOUT CONCENTRATE
The processing fee that went to zero
Copper separates the two roles cleanly, because the Chinese buying and the Chinese processing can each be measured on their own.
A copper miner sells concentrate, which is crushed and floated ore containing roughly 25 to 30 per cent copper. A smelter turns that concentrate into blister or anode copper. A refinery turns that into cathode metal. Each charges the miner a fee for its step. The smelter's fee is the treatment charge, or TC, quoted per dry tonne of concentrate. The refinery's is the refining charge, or RC, quoted per pound of payable copper. When concentrate is plentiful the fee is high, because miners compete for smelter capacity. When concentrate is scarce the fee falls, because smelters compete for material.
The benchmark fee is negotiated annually between a large miner and a large smelter. For 2025 contracts Antofagasta and Jiangxi Copper settled at US$21.25 a tonne, a fall of about 73 per cent on the 2024 settlement of roughly US$80[R70]. On 19 December 2025 Antofagasta agreed a 2026 benchmark of US$0.00 a tonne with a Chinese smelter, which Reuters and the International Energy Agency both describe as the lowest ever agreed. The IEA records the same settlement [R69].
Spot terms have gone further. The Shanghai Metals Market imported copper concentrate index reached minus US$102.84 a dry metric tonne on 15 May 2026, reported on 19 May, the first time the index had gone below minus US$100[R71]. A negative treatment charge means the smelter pays the miner for the concentrate. The fee has reversed direction.
FIG. 09 plots the benchmark treatment charge from 2024 to 2026 alongside the spot index.

FIG. 09 — The annual benchmark copper treatment charge for 2024, 2025 and 2026, with the May 2026 spot index shown below the line. A negative figure means the smelter is paying the miner. Original Samso illustration of sourced data. Benchmark settlements as reported by S&P Global Commodity Insights and Reuters, spot index from Shanghai Metals Market.
The cause is a mismatch between where copper is mined and where it is smelted. Global refinery capacity reached 32.6 million tonnes in 2024, a figure that includes electrowinning capacity taking no concentrate at all, while capacity utilisation ran at 84.3 per cent [R68]. China holds about half of the smelting and about eight per cent of the mining [R94]. A country that processes half the world's copper and digs up a twelfth of it has to buy the difference, and the price of buying it has now gone past the point where the processing itself is free.
For a copper miner, a benchmark of zero is the lowest annual treatment charge ever agreed, which is how both Reuters and the IEA describe it, and spot terms have since gone further. It is also why an investor looking for the Chinese slowdown in the copper price will not find it. LME copper was US$14,238.50 a tonne on 11 September 2026 against US$8,430 on 2 January 2024 [R67].
One caution on a figure that circulates. The IEA states copper briefly exceeded US$14,500 a tonne intraday in January 2026 [R69]. The highest LME cash settlement in January 2026 was US$13,844, on 29 January [R67]. An intraday spike is not captured by settlement data, so the two are not necessarily in conflict, but the US$14,500 figure should be attributed to the IEA and not presented as a settlement price.
Alara Resources (ASX: AUQ)
Alara Resources Limited is a copper-gold producer in the Sultanate of Oman[R72]. Its producing asset is the Al Wash-hi Majaza mine and concentrator in the Al-Kharis area, in Wilayat Al-Mudhaibi.
Alara holds 51 per cent of Al Hadeetha Resources LLC, and that company owns the mine. Al Hadeetha Investment Services LLC holds 30 per cent and Al Tasnim Infrastructure LLC holds 19 per cent.
The subsidiary's cash is ring-fenced, and the company says so itself. Its Appendix 5B, the quarterly cash flow statement the ASX requires it to lodge, states for the June 2026 quarter that cash inflows are almost exclusively inflows into Al Hadeetha Resources, and that those inflows "are not available for use by Alara (as a separate entity) for its own purposes" [R72]. The company also states it will need to conduct one or more capital raisings before subsidiary dividends begin.

PLATE 03 — The Al Wash-hi Majaza open pit in Oman at 30 June 2026, looking across the benches to the surrounding hills. Mining had reached the 365 metre level by the end of the financial year. Photograph reproduced from Alara Resources Limited, Quarterly Activities Report for the June 2026 quarter, page 4, with attribution [R72].
PLATE 03 is the company's photograph of the Al Wash-hi Majaza pit at the end of June 2026.
Production has reached and passed nameplate. The company announced on 19 March 2026 that the mine was running 6.4 per cent and the concentrator 6.1 per cent above nameplate on a financial year to date basis [R72]. Its managing director put it this way.
“Reaching and surpassing nameplate capacity is a testament to the dedication, expertise, and collaboration of our entire team. This milestone not only demonstrates the strength of our operations but also reinforces our confidence in the long-term potential of our flagship Al Wash-hi Majaza Copper project. We remain focused on maintaining consistent performance, optimizing efficiencies, and delivering sustainable value for our stakeholders.”
Atmavireshwar Sthapak, Managing Director, Alara Resources Limited, ASX and media release of 19 March 2026 [R72]
That statement carries no number in it, and the release's own numbers are on a financial year to date basis over a six-month average. On a single quarter the picture is tighter. In the June 2026 quarter mill feed reached 266,979 tonnes against a target of 272,000 tonnes, which the company reports as 98.2 per cent of its quarterly target [R72]. Running above nameplate across a financial year and running slightly under target in a quarter are both true, and they are different measures.
For the June 2026 quarter it reported run-of-mine production of 293,611 wet tonnes. The head grade of 0.87 per cent copper the company gives alongside it is a full-year FY2026 average and not a quarterly figure, milled 266,979 tonnes and produced 10,902 wet metric tonnes of concentrate. It sold 11,169 wet metric tonnes containing about 2,077 tonnes of copper and 1,556 ounces of gold, which the company reports as its highest quarterly shipment. A further 4,399 wet metric tonnes were waiting at Sohar Port for vessel allocation at quarter end, because of shipping disruption in the region.
Revenue was A$55,874,583 for the half year ended 31 December 2025, against A$19,005,668 in the previous corresponding half[R73]. For the year ended 30 June 2025 revenue was A$55,122,260 with a loss for the year of A$19,027,128[R74]. Receipts from customers for the twelve months to 30 June 2026 were A$119,220,000, which is cash received and not revenue. The statutory result for the year ended 30 June 2026 had not been lodged as at 7 September 2026.
Several counterweights stand beside those production figures.
Copper sales run under an offtake agreement with Trafigura covering the full copper and gold concentrate production of the mine for a term of eight years and two months from the start of concentrate production in May 2024 [R74]. Revenue is booked at 90 per cent of a provisional price. TABLE 02 sets out the borrowing position.
TABLE 02 — Alara Resources group facilities, drawings and cash. Compiled by Samso from the June 2026 quarterly report and Appendix 5B and from the half-year financial report.
Item | Amount | As at |
Facilities available | A$145,275,000 | 30 June 2026 |
Drawn against them | A$123,757,000 | 30 June 2026 |
Cash | A$27,340,000 | 30 June 2026 |
Working capital | Negative A$11,426,983 | 31 December 2025 |
The largest facility is a Sohar International Bank loan to Al Hadeetha Resources with a principal limit of about A$139.82 million, secured by mortgage over the subsidiary's plant, land and buildings [R72]. The facility and cash figures come from the June 2026 quarterly and its Appendix 5B, and the working capital figure from the half-year report [R73].
There is also unresolved litigation. Legal proceedings were served on the subsidiary by nearby residents in December 2025, seeking suspension of activities and invalidation of licences. The Primary Court of Ibra dismissed all substantive claims on 10 June 2026 with costs to the plaintiffs, and the claimants lodged an appeal on 3 July 2026, with a hearing scheduled for early November 2026 [R72]. Royalty rates for the mine are still under negotiation with the Omani mining authorities and are being provisioned for.
On resources, the published estimate rests on work completed in 2016. Al Wash-hi Majaza carried Indicated and Inferred Mineral Resources of 13.80 Mt at 0.86 per cent copper and 0.21 grams per tonne gold effective 30 June 2025, with a Probable Ore Reserve of 8.38 Mt at 0.88 per cent copper [R74]. The company states that these estimates derive from technical work completed in 2016 and have been updated only for mining depletion since. An independent external audit, the first since those studies, was under way with revised statements expected by the end of the first quarter of financial year 2027.
7.00 — THE OTHER KIND OF CHINA EXPOSURE
The China link is on the share register, and the going concern note is on the accounts
Eastern Platinum Limited, which trades as Eastplats on the Toronto Stock Exchange under ELR and on the Johannesburg Stock Exchange under EPS, was researched for this article as a chrome-into-Chinese-stainless-steel story. The company's filings do not support that description. It stays in this piece because what its filings do show is a China exposure of a kind the market rarely prices.
Chrome concentrate is smelted into ferrochrome, and ferrochrome is what goes into stainless steel. China is the dominant producer of both, so a chrome concentrate producer is, in principle, a way of holding Chinese industrial demand, at one remove and on the same mine-versus-smelter split this piece draws for copper. Eastplats does disclose a China link, in one sentence in its Annual Information Form. "The product is being exported, mostly to China"[R75]. The same sentence appears in the previous year's document. The Annual Information Form names no Chinese customer, carries no China-specific risk factor, and attaches no figure to that sentence.
The larger point about the framing is that the chrome business has largely gone. Eastplats splits its revenue between chrome concentrate and platinum group metal concentrate, and the split has moved a long way in three years[R76]. TABLE 03 gives that split.
TABLE 03 — Eastplats revenue by product, in US dollars, as reported in the company's audited financial statements and its half-year statements. Compiled by Samso from the filings cited in this section.
Period | Chrome concentrate | PGM concentrate | Total |
Year to 31 December 2023 | 101,752,000 (95.1%) | 5,192,000 (4.9%) | 106,944,000 |
Year to 31 December 2024 | 54,459,000 (87%) | 8,048,000 (13%) | 62,507,000 |
Year to 31 December 2025 | 21,652,000 (35%) | 39,934,000 (65%) | 61,586,000 |
Six months to 30 June 2026 | 4,425,000 (20%) | 17,331,000 (80%) | 21,756,000 |
FIG. 10 draws the same four periods as a single picture. The chrome share falls away and the platinum group metal share replaces it.

FIG. 10 — Eastplats revenue by product across three full years and the most recent half year. The final bar covers six months and is not comparable in size with the three years above it. The China story in this company turned out not to be in its revenue mix. Chrome did not fall because Chinese demand fell, it fell because the tailings ran out. Original Samso illustration of data reported by Eastern Platinum Limited in its audited financial statements and its half-year statements. The percentages are Samso's arithmetic.
The reason for the change is not Chinese demand. It is that the material ran out. Eastplats produced its chrome by re-mining an old tailings storage facility at the Crocodile River Mine, which is on the western limb of the Bushveld Complex about eight kilometres south of Brits in North West Province, South Africa [R75]. A tailings storage facility is where the finely ground waste from earlier processing was dumped, and modern equipment can recover metal from it that the original plant missed. That facility was fully processed and the retreatment operation ceased on 17 March 2025. Chrome is now a by-product of the underground ore being mined for platinum group metals.
Eastplats today sells 80 per cent of its revenue as platinum group metal concentrate, and it sells all of it to Impala Platinum Limited in South Africa under an evergreen offtake agreement entered into on 30 April 2006 [R75].

PLATE 04 — The Zandfontein plant at the Crocodile River Mine from the air, with the company's own labels on each part of the circuit. The two large thickeners at left and the milling and flotation buildings in the centre handle the underground ore that now supplies most of the company's revenue. Annotated aerial photograph reproduced from Eastern Platinum Limited, Investor Presentation, April 2026, slide 16, with attribution [R98].
PLATE 04 shows the Zandfontein plant at the Crocodile River Mine, with the processing circuits labelled by the company.
The China link in this company is on the share register and in the loan book.
Ka An Development Co. Limited holds 100,421,000 shares, or 49.0 per cent of the 204,941,426 shares outstanding, as at the date of the Annual Information Form of 31 March 2026[R78]. Changyu Liu, of Tianjin, is chairman of Ka An and has been chairman of Eastplats since June 2022. On 6 August 2026 the company announced that Mr Liu would become interim president and chief executive with effect from 13 August 2026[R79]. Ka An is also the lender, holding two secured credit facilities with a combined maximum limit of C$2.0 million, each secured by a charge over the company's chrome production and related proceeds [R76].
Mr Liu holds four positions at once. Mr Liu chairs Eastplats, chairs its largest shareholder, runs the company as interim chief executive, and controls the entity lending it money against its own production. Each of those appointments is disclosed. On Samso's reading, the effect of them together is that the parties on both sides of those loan agreements are no longer independent of each other.
That is control and financing, and it carries different risks from a customer relationship. Eastplats was not approached for comment, and this account rests on the company's own filings and its June 2026 information circular.
WHAT THE AUDITOR SAID Eastplats' financial statements for the year ended 31 December 2025 carry a material uncertainty related to going concern. The auditor, Davidson & Company LLP, records cash of US$177,000, a working capital deficit of US$56,936,000, an operating loss of US$21,555,000 and cash used in operations of US$5,542,000 [R76]. The audit opinion itself was not modified. By 30 June 2026 cash was US$362,000 and the working capital deficit had widened to US$67,981,000, against total current liabilities of US$114,445,000[R77]. The largest single item in those liabilities is US$53,711,000 of contracts payable to Union Goal Offshore Solutions Limited, the former chrome offtaker, which is in arbitration. The underground restart is also behind its own plan. Run-of-mine production for 2025 was 283,365 tonnes against a plan of 713,400 tonnes, which is 40 per cent of target [R75]. The stated goal is 70,000 tonnes a month by the end of 2026, a figure that appears in the company's April 2026 investor presentation. The Annual Information Form's own 2026 plan is up to 514,363 tonnes of underground ore for the year, which is about 43,000 tonnes a month. Both are quoted as published. The first half of 2026 delivered 106,798 tonnes, or about 17,800 tonnes a month. Two further items are quoted as published, following Samso's policy on discrepancies. The company's own management discussion for 2025 gives an operating loss of US$24,478,000 in its narrative and US$21,555,000 in its tables, the latter agreeing with the audited statements and the results release. And the corporate presentation of 22 April 2026 gives a Proved and Probable split of 3.95 Mt at 3.58 grams per tonne and 10.63 Mt at 3.72 grams per tonne, where the Annual Information Form gives 2.282 Mt at 4.75 grams per tonne and 12.298 Mt at 3.48 grams per tonne [R98]. The totals agree at 14.58 Mt and 1.72 million ounces. The splits do not. |

8.00 — IRON ORE AND THREE ANSWERS TO ONE PROBLEM
What Fortescue, Rio Tinto and BHP are each spending money on
Iron ore is the one commodity here where China is still purely the buyer, and its price has not moved. So the question for the three majors is not what China does next. It is where each of them is putting money, and on what belief.
Part 1 set out the grade problem. Standard Pilbara ore runs about 56 to 62 per cent iron. The direct reduction route to steelmaking, which is the lower-emissions route when the reductant is hydrogen made with low-carbon power, has conventionally needed a pellet feed of roughly 67 per cent iron. That figure and its sources are set out in Part 1 and are not repeated here. Simandou in Guinea, which began shipping in December 2025, carries Ore Reserves of 0.2 billion tonnes at 66.4 per cent iron and 1.3 billion tonnes at 65.0 per cent, and its first half 2026 sales averaged 65.8 per cent iron[R87].
One thing has changed since Part 1 was written. On 12 June 2026 Rio Tinto and China Baowu published the results of completed industrial-scale trials, concluding that "typical mid-grade ores mined in Western Australia's Pilbara region can be used as hydrogen-based direct reduction feedstock"[R88]. The route ran through a 5 million tonne a year grate-kiln for pelletising and then a 1 million tonne a year hydrogen-based shaft furnace, with a smelting test in a 500 kilogram electric furnace.
That does not retire the 67 per cent figure, which remains the conventional direct reduction pellet feed specification. What it does is move the argument from chemistry to cost. Pilbara ore can be fed into a direct reduction furnace. The question is what the extra steps cost and who pays for them. Mid-grade ore has to be pelletised first, and the reduced iron it makes then has to be melted in an electric smelting furnace rather than the electric arc furnace that higher-grade feed allows.
FIG. 11 sets the grades against that specification.

FIG. 11 — Iron content for standard Pilbara ore and for Simandou, against the roughly 67 per cent pellet feed specification the direct reduction route has conventionally needed. The dashed line is the specification, not a measurement. The Pilbara and Simandou sales figures are shipped product grades, the Simandou reserve figures are in-situ grades. Grade is what decides whether Pilbara ore can go into a low-emissions furnace at all, and so what the three majors have to spend on. Original Samso illustration of sourced data. Pilbara and direct reduction grades are as set out in Part 1 of this series. Simandou grades from Rio Tinto's disclosure.
Each of the three majors has answered the same problem differently, and the capital they have each committed says more than the language in their sustainability reports. TABLE 04 sets the three approaches side by side, with each company's position on Scope 3 emissions, which for an iron ore miner means the carbon released when a customer turns its ore into steel and is by far the largest part of its footprint.
Most Pilbara ore is hematite, which is mined and shipped much as it comes out of the ground. Magnetite is a different iron mineral, usually in lower-grade rock, which has to be concentrated first in a step called beneficiation. Beneficiation costs money and uses power, and it lifts the iron content of what is shipped.
TABLE 04 — How each of the three iron ore majors is answering the grade problem. Compiled by Samso from the company documents cited in this section.
Company | What it is changing | Capital committed | Scope 3 position |
Fortescue | The ore and the reductant, through magnetite concentrate and hydrogen | About US$3.9 billion at Iron Bridge, US$50 million at Christmas Creek | Net zero by 2040, stated as a target |
Rio Tinto | The furnace, and buying higher-grade ore in Guinea | US$6.2 billion Simandou share, more than A$35 million to the Calix plant | No Scope 3 reduction target |
BHP | Piloting a furnace jointly with Rio Tinto, after halting its own beneficiation plant | US$1.2 billion Jimblebar plant halted at about 80 per cent design, NeoSmelt pilot at final investment decision stage | Net zero Scope 3 by 2050, classified by BHP as a goal rather than a target |
Fortescue (ASX: FMG) is changing the ore and the reductant
Its Iron Bridge magnetite operation was commissioned to produce high-grade concentrate at a nameplate of 22 million tonnes a year on a 100 per cent basis, at an original product specification above 68 per cent iron, for a total project cost of about US$3.9 billion[R83]. In the year ended 30 June 2026 it produced 9.1 million tonnes, which is about 41 per cent of nameplate, and the company booked a US$750 million pre-tax impairment against it, citing a revised ramp-up schedule and a range of production scenarios.
Separately, its Christmas Creek green metal plant, announced in August 2024 at a cost of US$50 million with a stated capacity of more than 1,500 tonnes a year of green iron and a target of first production in 2025, announced first hot metal on 19 August 2026[R85]. That is about a year later than planned, and no cumulative tonnage has been disclosed. Fortescue Metals chief executive officer Dino Otranto said on 19 August 2026 that "nobody has solved green metal production using Pilbara ore at commercial scale yet. That's the challenge we're taking on" [R85].
Fortescue's 2040 Scope 3 target is intact. Its climate documents released on 20 August 2026 restate the target of net zero Scope 3 emissions by 2040[R84]. Samso has not been able to open the FY26 Climate Transition Plan itself, so the exact wording of the 2040 commitment in that document is unverified here and the target is described in the terms Fortescue has used in its earlier published statements.
The green energy division has been cut back all the same. Research and development spend on the green energy pipeline fell from US$483 million in the year to June 2025 to US$232 million in the year to June 2026 [R83]. Fortescue shipped a record 201.3 million tonnes of iron ore in that year, on revenue of US$16,966 million and underlying net profit after tax of US$3.5 billion, at a hematite cash cost of US$18.74 a wet tonne and a realised price of US$91 a dry tonne. Those two are on different moisture bases and cannot be subtracted, and the cost covers hematite only while the shipment figure includes Iron Bridge.
PLATE 05 is the Iron Bridge plant. The tanks and thickeners in it are the beneficiation step, which is the part that turns Pilbara ore into a concentrate a direct reduction furnace can take.

PLATE 05 — The Iron Bridge magnetite plant in the Pilbara from the air. The circular thickeners at the top left, the tank cells in the centre and the conveyors at the right are the beneficiation circuit, which is the step that lifts ore to a concentrate grade a direct reduction furnace can take. Photograph reproduced from Fortescue Ltd, "Fortescue's Iron Bridge commences high grade magnetite production", company website, with attribution [R101].
Rio Tinto (ASX: RIO) is changing the furnace, and buying grade elsewhere
Its Simandou share cost US$6.2 billion, of which US$1.7 billion remained at the half year to 30 June 2026 [R87]. Rio holds 53 per cent of SimFer Jersey, which holds 85 per cent of the mine company, and states an attributable capacity of about 27 million dry tonnes a year out of SimFer's roughly 60 million. Sales guidance for 2026 is 5 to 10 million tonnes on a 100 per cent basis, and actual first-half sales were 0.4 million tonnes on the same basis.
At home Rio has gone the other way. On 17 November 2025 it paused its own BioIron technology, stating that "the current furnace design for BioIron requires additional development to minimise technical risks and optimise its performance", and committed more than A$35 million to Calix's demonstration plant at Kwinana instead, supplying up to 10,000 tonnes of Pilbara ore[R89]. The stated attraction of the Calix process is "elimination of ore pelletisation, and enabling the use of fines and lower-grade iron ores".
Rio Tinto has no Scope 3 reduction target. Its 2025 Annual Report contains none, and its climate change page offers briefing papers and no commitment[R86]. Its Scope 1 and 2 target is to "reduce our net Scope 1 and 2 emissions by 50%" by 2030 against a 2018 baseline, and it reported 31.5 million tonnes of carbon dioxide equivalent for 2025, which is 14 per cent below that baseline.
BHP (ASX: BHP) has tried both, stopped one, and says the problem is smaller than the other two think
BHP produced 265 million tonnes of iron ore on its own share basis in the year to 30 June 2026, on iron ore segment revenue of US$23,883 million and a Western Australia unit cost of US$19.66 a tonne[R90]. It plans to increase production to more than 305 million tonnes a year on a 100 per cent basis by the fourth quarter of financial year 2028. The two figures are on different bases and should not be subtracted, since the 265 million tonnes is BHP's own share and the 305 million tonne target is the joint ventures' full output.
BHP has no magnetite or beneficiation project in Western Australia. It halted a US$1.2 billion beneficiation plant at Jimblebar in May 2025 after design reached about 80 per cent completion, on the grounds that the project was not well placed to compete for funding and had marginal economics. That decision was not disclosed in a BHP results release and was reported a year later, by ABC News on 26 May 2026 [R90].
BHP's remaining position on the grade problem is NeoSmelt, a pilot electric smelting furnace at Kwinana with BlueScope, Rio Tinto, Woodside and Mitsui, at 30,000 to 40,000 tonnes a year of molten iron, with a final investment decision expected in 2026[R93]. Its stated purpose is to "prove Pilbara iron ore can be used to produce lower-carbon emissions molten iron using a direct reduced iron - electric smelting furnace (DRI-ESF) pathway".
BHP publishes definitions of the two words it uses for its commitments. It defines a target as "an intended outcome in relation to which we have identified one or more pathways for delivery of that outcome, subject to certain assumptions or conditions" and a goal as "an ambition to seek an outcome for which there is no current pathway(s), but for which efforts are being or will be pursued towards addressing that challenge, subject to certain assumptions or conditions"[R92]. BHP classifies its steelmaking Scope 3 commitments as goals, not targets. On its own published definition that means no current pathway has been identified, while efforts are being or will be pursued.
FIG. 12 compares capital expenditure and the disclosed decarbonisation share for the three companies.
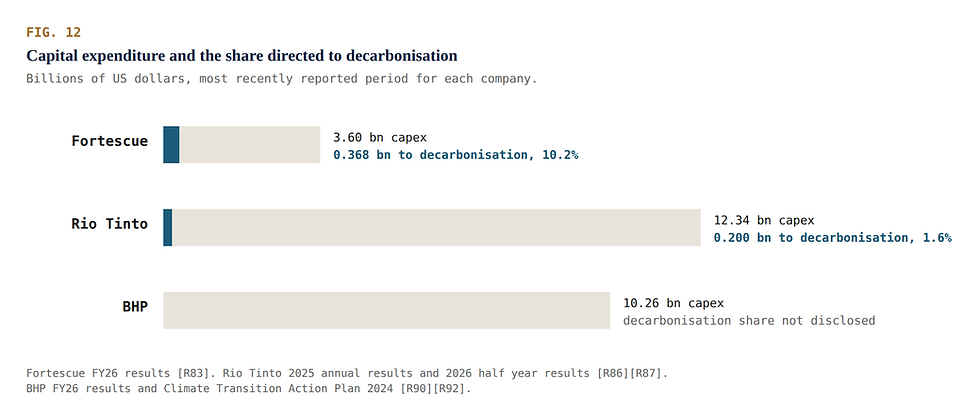
FIG. 12 — Capital expenditure for each of the three iron ore majors in its most recently reported period, with the portion each company discloses as directed to decarbonisation. Ten per cent, about 1.6 per cent, and not disclosed. The periods and the scopes differ, since Fortescue's year ended 30 June 2026 and is almost all iron ore while Rio Tinto's ended 31 December 2025 and covers every commodity it mines. Original Samso illustration of data reported by Fortescue, Rio Tinto and BHP in the results releases and climate documents cited in this section.
The capital figures give the clearest comparison of the three. In its most recently reported period Fortescue directed US$368 million of US$3.6 billion of capital expenditure to decarbonisation, which is about 10.2 per cent [R83]. Rio Tinto directed about US$0.2 billion of US$12,335 million, which is about 1.6 per cent [R86]. BHP does not disclose an annual decarbonisation split at all. It gives a decade-long envelope of "up to US$4 billion" of spend and commitments to financial year 2030 and folds decarbonisation into sustaining capital in period reporting [R92]. That is a disclosure gap.
BHP'S PUBLISHED VIEW DISAGREES WITH PART 1 Part 1 of this series argued that China's structural position is deteriorating and that the effects are already showing. BHP's published house view says something different about steel specifically, and it is quoted here in its own words. BHP's Economic and Commodity Outlook of 18 August 2026 states that "despite the ongoing weakness in China's property market, China's steel production has remained resilient at around one billion tonnes for seven consecutive years", and that advanced manufacturing and industrial upgrading are "expected to support crude steel at roughly this level for the remainder of the decade"[R91]. The two positions can be tested against the same data. The World Steel Association has Chinese crude steel at 960.8 million tonnes in 2025, down 4.4 per cent [R81]. China's National Bureau of Statistics has January to July 2026 at 577.04 million tonnes, down 3.1 per cent [R82]. So output is falling at roughly three to four per cent a year, and it is falling from a level that is still close to a billion tonnes. Both descriptions are accurate. BHP is describing the level and this series is describing the direction. Which of the two carries more weight depends on how long a position is held, and that is a judgement each investor makes for themselves. |
9.00 — WHAT AN INVESTOR IS ACTUALLY BUYING
Three bets, and four companies that are neither
Pulled together, the seven companies are not variations on a single theme, and treating them as one China trade would be a mistake. TABLE 05 sets out what each one rests on.
TABLE 05 — The commodities in this piece, China's role in each, and the listed companies on the receiving end. Price changes are measured from the start of 2025 to the latest observation, the same basis as FIG. 01. Compiled by Samso from the sources cited in the sections above.
Commodity | China's role | Price, start of 2025 to latest | Companies in this piece |
Tungsten | Mines about 79 per cent of world supply and licenses its export | Up close to nine times | EQ Resources (ASX: EQR) |
Tin | Mines about 24 per cent, and five Chinese refiners make 41 per cent of refined output | Up about 90 per cent | Metals X (ASX: MLX) |
Copper | Mines about 8 per cent and smelts about 51 per cent | Up about 63 per cent, with the treatment charge at zero | Alara Resources (ASX: AUQ) |
Chrome and platinum group metals | Buyer of chrome, and in this case also the largest shareholder and the lender | Not the driver here, see section 7.00 | Eastern Platinum (TSX: ELR) |
Iron ore | The buyer, and mines about 11 per cent | Down about 3 per cent | Fortescue (ASX: FMG), Rio Tinto (ASX: RIO), BHP (ASX: BHP) |
The first bet is on Chinese export policy staying where it is. That is the tungsten bet, and EQ Resources is an ASX way of holding it. The February 2025 licence regime was never suspended when the October 2025 package was, and the export and price-gap data since then point at that measure as the larger part of the cause, though no source separates it from defence demand. If that measure is relaxed, the case weakens quickly. EQ Resources realised US$962 per mtu as recently as the March 2026 quarter. Every revenue figure the company has published since its last audited accounts is unaudited, and it has an open regulatory notice in Spain.
The second bet is on a supply base that is shrinking for reasons that have nothing to do with China. That is the tin bet, and Metals X is an ASX way of holding it. Myanmar, Indonesia and a global refined deficit did that, not Beijing. It is also the bet with the strongest balance sheet behind it, at A$374 million of cash and no debt, and an ownership position that gives it only half of one mine's output.
The third bet is on the mismatch between where copper is dug and where it is smelted. A benchmark treatment charge of zero is the plainest of these signals to read, because it is a single negotiated number rather than an inference drawn from a price. Alara Resources is a way of holding it, with the significant qualifications that the company owns 51 per cent of the operating subsidiary, that the subsidiary's cash is not available to the parent, that A$123.76 million of debt is drawn against the subsidiary's assets, that the resource estimate rests on technical work completed in 2016, and that an appeal against the dismissal of a local legal challenge is listed for early November 2026.
Iron ore is the exception in this list. It is the one commodity here where China is purely the buyer, and it is the one that has not moved. The three majors are not really a bet on the China thesis at all. They are a bet on which of three approaches to the grade problem turns out to be cheapest, and on that question BHP has committed the least capital and classifies its steelmaking commitments as goals, not targets, which on its own published definition means no pathway has yet been identified.
Eastplats is in this list for a different reason. The chrome-into-China description of it was a reasonable thing to expect, and the filings do not support it. Reading the filings instead of the reputation is what caught it. It is also the company on this list carrying a going concern material uncertainty, with US$362,000 of cash against a working capital deficit of US$67.98 million at 30 June 2026.
SAMSO TAKE If I had to put the whole of Part 2 into one sentence, it would be this. The market has spent two and a half years repricing who controls supply, while most of the commentary has been arguing about Chinese demand. I do not know how long that lasts. A tungsten price that has gone up nine times in twenty months is not a normal thing and I would not assume it holds. Export licensing is a policy, and policies get changed, sometimes quickly and sometimes as part of a negotiation about something else entirely. Part of what an investor is buying in EQ Resources is a bet that a Chinese ministry does not change its mind. The tin and copper positions look more durable to me, because they do not depend on a single ministry in a single country. Wa State, Jakarta and a global smelter fleet would all have to change direction at once. A mining district in Wa State that is still being dewatered and charged for the privilege, and a smelter fleet that is too large for the world's concentrate supply, are not problems that a single announcement fixes. What I keep coming back to is the question Part 1 finished on, which was whether China has a working route back and how long it takes. Nothing in the last two and a half years of price data answers that. What the price data does say is that an investor does not have to answer it in order to be positioned. The supply side has been repricing regardless. So the question I would put to a reader is this. If you have been waiting for a view on China before deciding what to do, is the thing you have actually been waiting for already priced somewhere you were not looking? |

The vocabulary, in plain English
All-in sustaining cost (AISC). A broader cost measure than cash cost. It adds the capital needed to keep an existing mine running, so it is closer to what the operation really costs.
Ammonium paratungstate (APT). The intermediate chemical that most tungsten metal is made from, and the product whose price is most often quoted for tungsten.
Appendix 4C and Appendix 5B. Quarterly cash flow reports that ASX-listed companies of certain types must lodge. They show actual cash received from customers, which can differ from accounting revenue.
C1 cash cost. The direct cash cost of producing a unit of metal, before capital, financing and corporate overheads.
Concentrate. Crushed and processed ore with the waste rock largely removed, sold to a smelter or refinery for final processing. It is not metal.
Direct reduction (DR, DRI). A way of making iron without a blast furnace, using gas or hydrogen instead of coke. It conventionally needs a higher-grade iron feed than a blast furnace does.
Going concern material uncertainty. A statement in an audit report that events or conditions exist which may cast significant doubt on a company's ability to continue operating. It is not the same as an adverse audit opinion.
Grade. How much of the wanted metal is in a tonne of rock, given as a percentage or in grams per tonne.
JORC Code. The Australasian reporting standard for Mineral Resources and Ore Reserves. NI 43-101 is the equivalent Canadian standard.
LME cash settlement. The London Metal Exchange's official daily price for immediate delivery of a metal. It is the price most commonly quoted for copper and tin.
Measured, Indicated and Inferred. Confidence categories for a Mineral Resource, from highest to lowest. Only Measured and Indicated material can be converted into an Ore Reserve.
Metric tonne unit (mtu). The pricing unit for tungsten. One mtu is ten kilograms of contained tungsten trioxide.
Mineral Resource and Ore Reserve. A Mineral Resource is mineralisation that could reasonably be expected to become economic. An Ore Reserve is the part of it that studies have shown is economic to mine now.
Magnetite and hematite. Two iron minerals. Hematite is the higher-grade ore that makes up most Pilbara production and is shipped much as it is mined. Magnetite occurs in lower-grade rock and has to be concentrated first, which costs money but produces a higher-grade product.
Beneficiation. The processing step that removes waste minerals and lifts the metal or iron content of what is sold. For magnetite it is what turns a low-grade ore into a high-grade concentrate.
Standard tonne. The Chinese pricing unit for tungsten concentrate. It is a tonne of material at a reference grade, not a tonne of contained metal, so a price per standard tonne is not comparable with a price per tonne of concentrate at another grade.
Nominal cash cost. EQ Resources' own term, which the company defines as cost of goods sold after inventory movement. It is struck against tonnes sold and not tonnes produced, it is narrower than C1 cash cost and much narrower than all-in sustaining cost, and it is not a standard measure, so two companies using it may not mean the same thing.
Provisional price. Concentrate is often invoiced before its final metal content and price are settled, so the seller books a provisional amount, here 90 per cent, and adjusts later.
Run-of-mine (ROM). Ore as it comes out of the mine, before any processing, usually reported as tonnes delivered to the plant or to a stockpile.
Shaft furnace and grate-kiln. A shaft furnace is the vessel in which iron ore is reduced to iron by gas or hydrogen. A grate-kiln is the equipment that turns fine ore into the pellets a shaft furnace needs.
Nameplate capacity. The output a plant was designed to achieve. Actual output can run above or below it.
Offtake agreement. A contract to sell future production to a named buyer, usually on agreed pricing terms and often signed before a mine is built.
PGM (platinum group metals). Platinum, palladium, rhodium and related metals, usually reported together as 4E or 6E ounces.
Proved and Probable. Confidence categories for an Ore Reserve, from higher to lower.
Scope 1, 2 and 3 emissions. Scope 1 is emissions a company produces directly. Scope 2 is from the energy it buys. Scope 3 is everything else in its value chain, including what customers do with its product. For an iron ore miner, Scope 3 is by far the largest.
Tailings storage facility. Where the finely ground waste from earlier processing was dumped. Modern equipment can sometimes recover metal from it that the original plant missed.
Treatment charge and refining charge (TC and RC). The fee a smelter charges a miner for turning concentrate into metal. It falls when concentrate is scarce.
Wet metric tonne and dry metric tonne. Concentrate is sold with moisture in it. A wet tonne includes that moisture, a dry tonne does not, so the two are not interchangeable.
References and sources
Numbering continues from Part 1 of this series, which used [R1] to [R50]. Each entry carries an identifier, and the same identifier appears in the body text at the point that source is used. Clicking a marker in the body takes you to the entry, and every entry is cited at least once.
Photographs reproduced here are company images from public releases and presentations, credited to the company, the document and its release date. Figures labelled FIG are Samso's own charts of data drawn from the sources named in each caption, except where a caption states that the figure is reproduced, in which case the source is credited there. Tables are compiled by Samso from the company filings cited in the surrounding text.
Commodity prices, share prices and cash balances change daily and are stated as at the dates given. Every price was rechecked on 14 September 2026. The London Metal Exchange settlements for tin and copper are as at 11 September 2026, the last settlement before that date. The tungsten and iron ore series are published monthly rather than daily, so the most recent figures available are the China Tungsten Industry Association's review of 31 August 2026 and the World Bank's monthly average for August 2026. Company figures carry the date of the document they came from and do not move.
Where a company's own documents give two different figures for the same thing, both are quoted as published and the document each came from is named. Resolving such differences belongs to the company and not to this article.
[R51] United States Geological Survey, "Mineral Commodity Summaries 2026: Tungsten", published 6 February 2026.
[R52] Ministry of Commerce and General Administration of Customs of the People's Republic of China, Announcement No. 10 of 2025, "Decision on Implementing Export Controls on Items Related to Tungsten, Tellurium, Bismuth, Molybdenum and Indium", 4 February 2025, as reproduced by the International Energy Agency policies database and by Shanghai Metals Market.
[R53] China Tungsten Industry Association, weekly European APT price assessments and monthly export statistics compiled from China's General Administration of Customs data, 2026.
[R54] Fastmarkets, published price assessments and market commentary on ammonium paratungstate, January to June 2026, including the report of 9 January 2026 on China's export prohibition to Japan.
[R55] EQ Resources Limited, Quarterly Activities Report and Appendix 5B for the quarters ended 31 March 2026 and 30 June 2026.
[R56] EQ Resources Limited, Annual Report 2025, released 30 September 2025.
[R57] EQ Resources Limited, "Record A$55m Revenue As Production Ramp Up Continues", 2 September 2026. Gives August 2026 group production of 19,068 mtu, group sales of 17,246 mtu, revenue of A$55.1 million and an average realised price of US$2,269 per mtu, all subject to the company's footnote that the figures are subject to final assays and reconciliation.
[R58] EQ Resources Limited, "Barruecopardo Mine Increases Ore Reserves By 39%", 22 October 2025.
[R59] United States Geological Survey, "Mineral Commodity Summaries 2026: Tin", published 6 February 2026.
[R60] United States Geological Survey, Mineral Industry Surveys, "Tin in December 2025", published April 2026, sourcing CRU.
[R61] London Metal Exchange official cash settlement prices for tin, as republished in the Westmetall price history, observed 11 September 2026.
[R62] International Tin Association, reports on the Man Maw suspension and restart in Wa State and on Indonesian licensing, February 2024 to March 2026.
[R63] Metals X Limited, Quarterly Report for the quarter ended 30 June 2026, released 27 July 2026.
[R64] Metals X Limited, Appendix 4D and Half Year Report and Accounts for the half year ended 30 June 2026, released 28 August 2026.
[R65] Metals X Limited, Annual Report for the year ended 31 December 2025, released 25 March 2026.
[R66] Metals X Limited, "2026 Renison Mineral Resource Update", 29 June 2026.
[R67] London Metal Exchange official cash settlement prices for copper, as republished in the Westmetall price history, observed 11 September 2026.
[R68] International Copper Study Group, "The World Copper Factbook 2025".
[R69] International Energy Agency, "Copper prices have hit record highs, but smelters face mounting strategic pressures", commentary, 2 March 2026.
[R70] S&P Global Commodity Insights, report of the Antofagasta and Jiangxi Copper 2025 term settlement, 6 December 2024, and Reuters, report of the Antofagasta 2026 benchmark settlement, 19 December 2025.
[R71] Shanghai Metals Market, Imported Copper Concentrate Index, reported 19 May 2026.
[R72] Alara Resources Limited, Quarterly Activities Report and Appendix 5B for the quarter ended 30 June 2026, lodged 31 July 2026, together with the announcements of 19 March 2026, 10 June 2026 and 3 July 2026.
[R73] Alara Resources Limited, Half-Year Financial Report for the half year ended 31 December 2025, lodged 16 March 2026.
[R74] Alara Resources Limited, revised Annual Report for the year ended 30 June 2025, re-lodged 14 November 2025.
[R75] Eastern Platinum Limited, Annual Information Form for the year ended 31 December 2025, dated 31 March 2026.
[R76] Eastern Platinum Limited, audited consolidated financial statements and management's discussion and analysis for the year ended 31 December 2025, dated 31 March 2026.
[R77] Eastern Platinum Limited, condensed interim financial statements for the six months ended 30 June 2026, released 13 August 2026.
[R78] Eastern Platinum Limited, Notice of Meeting and Management Information Circular for the annual meeting of 17 June 2026, dated May 2026.
[R79] Eastern Platinum Limited, "Eastern Platinum Limited Announces CEO Transition", 6 August 2026.
[R80] World Bank, Commodity Price Data, monthly prices, iron ore fines 62 per cent iron content cost and freight to China, updated 2 September 2026.
[R81] World Steel Association, "December 2025 crude steel production and 2025 global crude steel production", press release, 23 January 2026.
[R82] National Bureau of Statistics of China, crude steel output for January to July 2026, released 17 August 2026, as reported by Mysteel.
[R83] Fortescue Ltd, FY26 Full Year Results Presentation and FY26 Annual Report and Appendix 4E, both released 20 August 2026.
[R84] Fortescue Ltd, Climate Transition Plan 2026 and FY26 Sustainability Report, both released 20 August 2026.
[R85] Fortescue Ltd, "Fortescue produces first hot metal in milestone towards Australian green iron", 19 August 2026, and "Fortescue starts works on Green Metal Project", 15 August 2024.
[R86] Rio Tinto, 2025 Annual Results release of 19 February 2026 and 2025 Annual Report, together with the company's published climate change disclosures.
[R87] Rio Tinto, 2026 Half Year Results, 29 July 2026, second quarter 2026 production results, 15 July 2026, and the Simandou Mineral Resource and Ore Reserve statement of 6 December 2023.
[R88] Rio Tinto, "China Baowu and Rio Tinto complete Pilbara Blend iron ore pelletisation and direct reduction trials", 12 June 2026.
[R89] Rio Tinto, "Rio Tinto partners with Calix to test low emissions steel making in Western Australia, pauses BioIron", 17 November 2025.
[R90] BHP Group, results for the year ended 30 June 2026, exchange release and results presentation, 18 August 2026. The Jimblebar beneficiation plant decision is as reported by ABC News on 26 May 2026 and is not disclosed in a BHP results release.
[R91] BHP Group, Economic and Commodity Outlook, 18 August 2026.
[R92] BHP Group, Climate Transition Action Plan 2024, released August 2024, including its published definitions of "target" and "goal".
[R93] BHP Group, "BlueScope, BHP and Rio Tinto select WA for Australia's largest ironmaking electric smelting furnace", 17 December 2024, and "NeoSmelt welcomes federal government support and signs two new participants", 17 June 2025.
[R94] United States Geological Survey, "Mineral Commodity Summaries 2026: Copper" and "Mineral Commodity Summaries 2026: Iron Ore", published 6 February 2026.
[R95] Pillsbury Winthrop Shaw Pittman, register of Chinese export control announcements and their suspension status, and White & Case, "China imposes extraterritorial jurisdiction and a 50% Rule in export controls on rare earths", 2025 to 2026.
[R96] EQ Resources Limited, Investor Presentation, 14 July 2026, slides 8 and 14. Locality maps in FIG. 05 reproduced from slide 8 of that presentation.
[R97] Metals X Limited, 2026 Annual General Meeting Presentation, 19 May 2026. The Renison locality map in FIG. 08 is reproduced from slide 11 of that presentation.
[R98] Eastern Platinum Limited, Investor Presentation, April 2026. PLATE 04 is reproduced from slide 16 of that presentation.
[R99] China Tungsten Industry Association, "Tungsten Market in March 2026: Initial Rise Followed by Decline", monthly market review, March 2026. Gives the domestic APT peak of about RMB 1.5 million a tonne in the first half of March, the month-end price of about RMB 1.48 million, the European APT range of US$2,800 to US$3,150 per mtu with the association's own conversion to renminbi, and tungsten concentrate above RMB 1 million a standard tonne in early March.
[R100] China Tungsten Industry Association, "Tungsten concentrate Prices Rise, APT Prices Fall in August 2026", monthly market review, August 2026. Gives domestic APT at about RMB 600,000 a tonne at 31 August 2026, high-grade concentrate at about RMB 415,000 to RMB 420,000 a standard tonne, and European APT at US$2,900 to US$3,000 per mtu with the association's own conversion to renminbi.
[R101] Fortescue Ltd, "Fortescue's Iron Bridge commences high grade magnetite production", company website article and accompanying photograph, accessed 7 September 2026.
[R102] The Edge Singapore, "Iron ore tops US$100 on position unwinds and China buying hopes", 7 September 2026. The report originates with Bloomberg under the same headline and the same date.
[R103] EQ Resources Limited, "EQR Signs Binding Agreement For US APT Plant JV", 15 September 2026. Joint venture over the Springer Tungsten Complex, Nevada, with The Elmet Group on 70 per cent as operator, Blue Moon Metals on 20 per cent and EQ Resources on 10 per cent.
Cover photo: Rare earth oxides, Peggy Greb, USDA Agricultural Research Service. Public domain, via Wikimedia Commons (https://commons.wikimedia.org/wiki/File:Rareearthoxides.jpg). Reproduced photograph, shown faded under a navy overlay on the article thumbnail.
 The Samso Way – Seek the ResearchHere at Samso, we pride ourselves on delivering content for investors that is independent and informed by over three decades of experience in the industry. Our content is well-researched and is only created if I see merit in discussing the company's story. Our mission is simple: cut through the noise and spotlight what matters—genuine stories, grounded insights, and real opportunity. Investors can explore our four core platforms:
There may be numerous paths to success in investing, but the common thread among successful individuals is that they remain committed to making informed decisions. Equip yourself with the right knowledge and tools, and you will be well on your way to achieving your financial goals. Most importantly, investors need to be absolutely diligent in understanding their own risk-reward tolerance and capabilities. Never bite off more than you can chew. As they say, Rome wasn't built in a day, and the Great Wall stood because it took centuries to complete. The Samso Philosophy: Stay curious. Stay sharp. And remember—digging deeper always uncovers the real value. In Life, there is no such thing as a Free Lunch. Never bite off more than you can chew is my parting comment. Happy Investing, and the only four-letter word you need to know is DYOR. To support our independent work, please head over to our Support Page and give us a helping hand in any of the ways listed. This is a new initiative for the Samso Platform, and it was always the concept of Samso when we started this journey in 2018. DisclaimerThis article is general information only. It is not financial product advice and it does not take into account any reader's objectives, financial situation or needs. It contains no price targets, no valuations and no recommendation to buy, hold or sell any security. Companies named in this article are used as historical illustrations of events that have already occurred and no view is expressed on their current merits. Readers should consider obtaining advice from a licensed financial adviser and should conduct their own research before making any investment decision. Samso and its associates may hold interests in companies mentioned. About SamsoSamso is a trusted platform that equips dedicated investors with up-to-date industry knowledge and insights from top CEOs and thought leaders. By staying informed on business advancements and market trends, investors can enhance their financial decisions through a combination of expert guidance and their own research. Coffee with Samso, Samso Insights, Samso News and Samso Research are four ways into the same work. Interviews, long-form research, short takes on announcements and company-specific studies. Every one of them is about how to think about investing rather than what to buy. Samso Insights | www.samso.com.au | An Investor Lens on ASX-Listed Companies |


Comments