

The Known Tin and Tungsten Fields of Eastern Australia, Part 1 of 3

Updated: 11 hours ago
Eastern Australia's tin and tungsten deposits have been known, drilled, studied and in many cases mined for a century, then set aside. This first note of a three-part series maps that register. It covers two belts, one historic district, and a pipeline that is far more about tin than the tungsten headlines suggest.

Samso Insights | Research Insights | Tin and Tungsten Register | Samso Geology Series |
READING THE SERIES The Known Tin and Tungsten Fields of Eastern Australia runs in three parts. Part 1, this piece. The register. What is in the ground across Queensland, New South Wales and Tasmania, who holds it, and what the pattern of development says. Part 2. The metallurgy. Why head grade on its own does not decide which deposits get built. Part 3. The price. |
WHAT THIS PIECE COVERS Deposits found a century ago, and why they are being counted again now. Two granite belts, and the district that connects them. The Herberton Tin Field, and its two kinds of ore. The corporate history behind 13 Mt of defined tin and no mine. 5.00 THE TUNGSTEN SHADOW, NORTH Watershed, Mt Carbine, and a hub that is already working. Western Tasmania, and the register's one producing spine. 7.00 THE TUNGSTEN SHADOW, SOUTH Dolphin and Kara, the two operating tungsten producers. Taronga in New England, the largest tin resource by tonnage. The master table, with provenance marked row by row. What the register says once it is read as one document. Where every figure and claim in this article came from. |
A note on the vocabulary and the sources. Technical and mining terms are explained in plain English where they first appear, and all of them are collected in one box at the back. Every source carries an identifier, [R1] to [R36], and that identifier appears in the body text at the point the source is used, so any figure can be traced to where it came from.

1.00 — THE PREMISE
Eastern Australia's tin and tungsten deposits were found a century ago
Eastern Australia's tin and tungsten deposits have been known for well over a century. The Herberton field in North Queensland has been mined since the 1880s. Renison in Tasmania has been in production since 1968. The Gilmore mine closed in 1980, Cleveland in the 1980s, Dolphin in 1992, Ardlethan in the same era. Most of these deposits were drilled, and in several cases taken through full feasibility studies, decades ago. Then the tin price collapsed in 1985 and the tungsten price followed. Work on these deposits stopped.
Work has restarted because prices have recovered. Tin reached an all-time high above US$50,000 a tonne in June 2026, with roughly a third of world supply in doubt across Indonesia, Myanmar and the DRC.[R1][R2] Ammonium paratungstate, the traded form of tungsten, has been trading above US$3,000 per metric tonne unit against a ten-year history mostly spent below US$350. A metric tonne unit is 10 kilograms of contained tungsten trioxide, and the tungsten market is thin enough that a quoted price can move sharply on small volumes.[R3][R4] Part 3 covers what those prices do to older studies. Part 1 sets out what the deposits are, where they are, who has owned them, and why a field this well known has produced so few mines.
The public conversation in 2026 is dominated by tungsten, the critical-minerals lists and supply security. The Eastern Australian project pipeline is tin first. The Herberton field was overwhelmingly a tin producer. Tasmania's flagship, Renison, is a tin mine. The most advanced development projects, Heemskirk and Taronga, are tin. Tungsten is present across the register, in fewer projects and smaller volumes than tin. Each tungsten occurrence is marked as it appears. FIG. 01 maps the field and its main deposits.


2.00 — THE MAP
Two belts, and a third district in between
The register divides naturally into two granite provinces and one connecting district. In the north, the Herberton Tin Field and its surrounds, inland from Cairns, where granites of the Kennedy Igneous Association, roughly 320 to 280 million years old, intruded the sediments and limestones of the Hodgkinson Province.[R5][R6] In the south, western Tasmania and its islands, where Devonian granites, older again at roughly 400 to 360 million years, did the same job in the rocks around Zeehan, Luina and King Island. Between them is the New England orogen of northern New South Wales, a belt of folded and intruded rock where granites of roughly 280 to 220 million years old built the Emmaville-Torrington tin district.[R7]
The same granite chemistry appears in each belt. Tin and tungsten were delivered by the most chemically evolved granites of each suite, the ones whose last melts concentrated these metals. In Queensland that is the O'Briens Creek Supersuite, which carries the tin-tungsten signature.[R6] Where those granites met limestone, they made skarns, altered contact rocks that host fine-grained ore. Where they fractured their own roofs and the surrounding sediments, they made quartz veins and greisen, which is granite altered by its own late fluids. Both are coarse-grained and simple to treat. Part 2 covers the difference between skarn ore and vein ore. FIG. 02 shows where the three belts are.

3.00 — THE NORTHERN BELT
The Herberton Tin Field and its two kinds of ore
The Herberton Tin Field, spread across the country between Herberton, Irvinebank, Stannary Hills and Mount Garnet, is Australia's second largest tin producing district, with more than 2,400 historical mines recorded and a hard-rock and alluvial history running from 1880 to 1985.[R8] The district also produced 12,260 tonnes of tungsten along the way.[R1] Almost nothing has been drilled since the field shut. Across one 432 km² block of it, only 85 holes have ever tested the Stannary Hills mines and 64 the Mt Garnet veins.[R1][R8]
The field's ore comes in two forms, vein and skarn, and they behave differently in processing. FIG. 03 maps the recorded historic mines and FIG. 04 compares the two ore styles.


The veins are small, rich and barely tested
The vein and greisen camps account for most of the field's recorded production, set out in FIG. 05. At Stannary Hills, over 100 mines worked two structures. The first is the 5 km Kitchener Trend, where a 1.3 km section between the Eclipse and You and Me mines produced about 120,000 tonnes at 2.3% tin from seven mines, and the 10 km Atlanta Trend, whose largest mine, Lass O'Gowrie, produced 6,885 tonnes at 7.6% tin. Only 17 holes have ever been drilled along the Atlanta Trend's whole 10 km length.[R8][R9] Between and below the old Kitchener workings, the sparse historic drilling includes 54 m at 0.45% tin from 6 m (with 6 m at 1.7%) and 2 m at 4.8% tin.[R1]

Further south, the Mt Garnet vein camp tells the same story. The Gilmore mine produced 26,169 tonnes at 7.6% tin to 193 m depth before closing in 1980. The Great Boulder mine produced 1,364 tonnes at 13.4%. Vulcan, in the field's core, produced a reported 180,790 tonnes at 7.6%.[R9][R10][R11] A kilometre northeast of Gilmore, the Stannex soil anomaly runs 2.0 km by 0.5 km. A soil anomaly is a patch of ground where soil sampling has returned elevated metal. Rock chips broken from the outcrop there assay up to 21.3% tin, and precisely six holes have been drilled into it, all in 1980. Some of those chips also carry 96 to 120 grams of indium per tonne.[R12] The nearby Jiminy anomaly, 1.5 km long with surface samples to 26.1% tin, has never been drilled at all.[R13]

The skarns are bigger, poorer and locked
Southwest of the Mount Garnet township, the geology changes. Here the granites intruded the limestones of the Chillagoe Formation and replaced them with skarn, a dense banded rock of magnetite, fluorite and calcium-silicate minerals that carries fine-grained cassiterite. Cassiterite is tin oxide, the mineral from which almost all tin is recovered.[R15] The banded fluorite-magnetite variety is so distinctive that the term for it, wrigglite, was coined in a 1975 James Cook University thesis written about these very rocks.[R16]
Three deposits define the camp and together they make up the largest defined tin inventory in Queensland. They are Gillian (3.6 Mt at 0.65% tin, massive magnetite-goethite), Pinnacles (7.0 Mt at 0.3% tin, wrigglite, with substantial fluorite) and Windermere (2 Mt at 0.27% tin), a combined 13.1 Mt at 0.39% for 51,700 tonnes of contained tin.[R11][R17] They have been drilled since 2007, taken through a prefeasibility study in 2013, a first pass at whether a mine could pay for itself, and a partial definitive study after it, and never mined. At Windermere, the cassiterite is so fine and so dispersed that X-ray diffraction could not detect discrete crystals.[R18] FIG. 06 sets out the three deposits and the obstacle each one carries.

SAMSO ACCESS Some of the work does not appear hereSamso holds back a set of Insights for members. Same method as this piece, the same sourcing and the same counterweights, on companies and sectors that do not make the public feed.
Samso News, Coffee with Samso and Research Workups will join the gated set later.  A$20 a month · cancel any time |
4.00 — WHO OWNED THE ROCKS
The corporate history of an idle inventory
The district has 13 Mt of defined tin and no mine. Metallurgy, price and corporate history all contributed. Part 2 covers the metallurgy and Part 3 covers the price. The corporate history is set out below, through the district's two mills.
The Mt Garnet mill, a 1 Mtpa concentrator beside the town, was built by Kagara Zinc in 2003 for base metals. Kagara collapsed in 2012. The Chinese-backed Snow Peak Mining bought the assets in January 2013. Consolidated Tin Mines, which had been drilling the skarns since 2007, published its Gillian-Pinnacles prefeasibility study in September 2013, began a definitive study, signed a technical cooperation agreement with Yunnan Tin, the world's largest tin producer, in 2014, then bought the mine and mill outright in April 2016 and became a base-metals producer instead. The tin study was never finished. In 2021 the company, renamed Aurora Metals, sold the tin project to the privately held Tablelands Mining Group, where it remains today, outside continuous disclosure. A private owner has no obligation to keep the market informed, so nothing further about the project is published.[R19][R20][R21]
The Mt Veteran mill, a 70,000 tonne a year gravity plant on the vein side of the district, had a better outcome. A gravity plant separates minerals by density, which works only where the ore mineral is coarse enough to break free of the rock around it. MGT Resources refurbished it and, in July 2013, shipped 17 tonnes of 65% tin concentrate made from coarse vein ore trucked 2 km from Dalcouth.[R22] Coarse vein ore in a simple plant produced a saleable concentrate. The mill is now in private hands, next to the revived exploration ground. FIG. 07 tracks eighteen years of ownership around the other mill, at Mt Garnet.[R9]

5.00 — THE TUNGSTEN SHADOW, NORTH
Watershed, Mt Carbine and a working hub
North Queensland hosts Australia's flagship tungsten operation and its most advanced tungsten development, both within trucking distance of the tin field.
Mt Carbine, 120 km northwest of Cairns, was a major producer in the 1970s and 1980s and even then used ore sorting, from 1973 to 1986. EQ Resources restarted it in 2019 by feeding 12 Mt of historic stockpiles grading just 0.07% tungsten trioxide, written WO₃ and the compound in which tungsten grade is reported, through X-ray sorters that eject about 10 per cent of the mass carrying over 90 per cent of the tungsten, ahead of gravity separation and flotation, a process that lifts the target mineral off on bubbles, to a roughly 50% WO₃ concentrate. The resource stands at 41.7 Mt at 0.23% WO₃, open-pit and underground mining are running, June 2026 quarterly sales set a record A$79 million, and a A$39 million plant expansion was approved the same month, explicitly to build a hub-and-spoke district operation drawing on Wolfram Camp (2.95 Mt at 0.28% WO₃) and newly acquired stockpiles at Mt White.[R14][R23][R24]
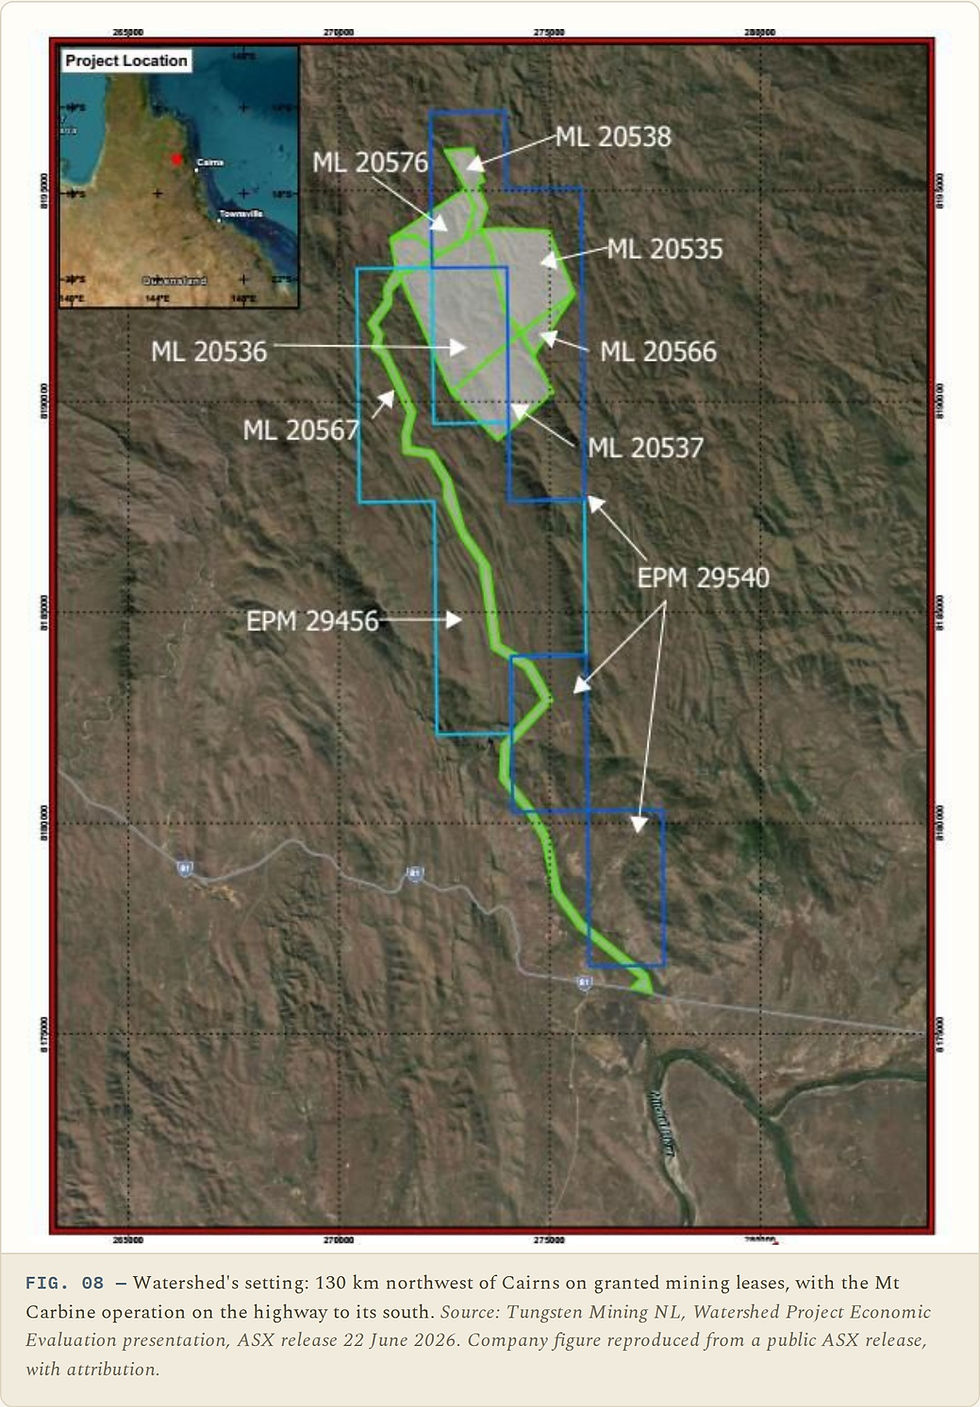
Watershed, 130 km north of Cairns, is the region's scheelite skarn. Scheelite is calcium tungstate, the main ore mineral of tungsten. Watershed holds 69.7 Mt at 0.11% WO₃ for 76,000 tonnes of contained WO₃, on granted mining leases with an environmental authority already in place.[R25] Watershed has been studied three times. A definitive feasibility study in 2014, a A$15 million change of hands in 2018, and a June 2026 economic evaluation carrying a pre-tax net present value of A$1.3 billion. Net present value is the cash a project is projected to generate over its life, discounted back to today's money, and it moves with the metal price the study assumes. That June 2026 figure comes from a preliminary economic evaluation rather than a feasibility study, and the orebody itself did not change across the three. Part 3 covers the effect of the tungsten price on those outcomes. FIG. 08 shows the granted leases over the deposit.[R25][R26]
6.00 — THE SOUTHERN BELT
Western Tasmania has a producing spine
Tasmania is the half of the register with a working tin mine at its centre. Renison Bell, near Zeehan, is a cassiterite deposit formed by replacing carbonate rock, mined underground since 1968, when a 4 Mt reserve supported a five-year plan. It is still mining. Through the Bluestone Mines Tasmania joint venture (Metals X, 50 per cent) it produces about 11,000 tonnes of tin a year, roughly 3.9 per cent of world supply. Reserves at March 2025 stood at 7.5 Mt at 1.37% tin, and December 2025 set a monthly production record. A reserve is the part of a resource that a study has shown can be mined at a profit.[R2][R27] Renison has processed fine, complex Tasmanian tin for more than fifty years. Its 27.5 Mt tailings resource, Rentails, the material left over from decades of processing, is a separate project. FIG. 09 shows Heemskirk and St Dizier beside it.[R2]

Fifteen kilometres away is the register's most advanced development, Heemskirk, the highest-grade undeveloped tin project in Australia. Its three lodes, Queen Hill, Severn and Montana, carry 9.51 Mt at 0.93% tin for 88,100 tonnes. The number to watch is mineralogical. 98 per cent of the tin is held in cassiterite, the recoverable mineral.[R2] The Queen Hill resource grew 41 per cent in February 2026, a Severn update is due in the September quarter, and a prefeasibility study is due in 2026. The satellite St Dizier deposit adds 2.26 Mt at 0.61%.[R2] FIG. 10 sets out the resource lode by lode. Part 2 explains why the cassiterite share affects recovery more than the head grade does.

Inland, the historic camps carry the belt's dual-metal character. Cleveland, near Luina, was a tin-copper mine with a tin resource of about 7.5 Mt at 0.75%. Mt Lindsay is a tin-tungsten-magnetite skarn of 10.4 Mt at 0.40% tin studied to feasibility in 2012. Moina is the textbook deposit, the fluorite-magnetite wrigglite skarn on which the defining 1981 Economic Geology study was written, holding 24.6 Mt at 16% fluorite with 0.1% tin and 0.1% WO₃, described by its holder as Australia's largest fluorite resource.[R2][R28][R29] Mt Bischoff, one of the great names of Australian tin, completes the historic roll. In the island's northeast, the Scamander field carries several metals at once. A 2023 drill hole cut 32 m of silver, tin, zinc and indium mineralisation, and nearby rock chips at Lutwyche run to 6.91% WO₃ in coarse wolframite, an iron-manganese tungstate and the other main tungsten ore mineral.[R2]

COFFEE WITH SAMSO The same companies, on the recordCoffee with Samso is the interview series. Management answering questions in long form, so the people behind a project can be judged alongside the numbers in a piece like this one. Free to watch. Companies commission an interview, and it stays free to everyone, permanently.  |
7.00 — THE TUNGSTEN SHADOW, SOUTH
Dolphin and Kara are the working answers
Tasmania also holds the register's two operating tungsten producers, Dolphin and Kara.
Dolphin, on King Island, has opened and closed with the tungsten price. A scheelite skarn described as the highest-grade tungsten deposit of significant size in the western world, it was mined from 1917 to 1992 and then closed on low prices with about half the known resource still in the ground. Group 6 Metals redeveloped it against a reserve of 4.43 Mt at 0.92% WO₃ and reached commercial production in 2023, then nearly failed on costs. Survival took a rescue plan that converted more than A$81 million of debt to equity, including the Tasmanian Government's A$10 million loan. The June 2026 quarter processed a record 77,953 tonnes as underground mining began.[R30][R31][R32] The deposit's grade and size did not change. Both the 1992 closure and the 2023 restart followed the tungsten price.
Kara, 35 km south of Burnie, has run continuously since 1978. A magnetite-scheelite skarn mined continuously by the private Tasmania Mines since 1978, its primary product is magnetite for coal washing. Scheelite concentrate comes out of the same circuit as a by-product and has been sold into European speciality steel and American markets for nearly fifty years.[R33] Kara has produced scheelite as a second product since 1978, which is the question Part 3 puts to the tin fields' tungsten.
8.00 — THE THIRD DISTRICT
The counter-intuitive deposit in New England, New South Wales
Northern New South Wales holds the register's largest tin resource by tonnage. Taronga, near Emmaville, grades just 0.10% tin, roughly a third of Windermere's grade, across 133 Mt for 138,100 tonnes of contained tin, ranking it among the ten largest undeveloped tin resources in the world.[R34] And unlike Windermere, it has a completed definitive feasibility study. That study puts capital at A$176 million for 3,600 tonnes of tin a year over nine years. It was published in May 2024, when tin traded well below the June 2026 high noted above, and an update is in preparation after 71 per cent of the resource reached Measured and Indicated confidence in April 2026. Measured and Indicated are the two higher confidence categories in a Mineral Resource reported under the JORC Code, the Australasian rulebook for reporting resources and reserves.[R34][R35]
Taronga is developable at 0.10% tin because of one property of its ore. Its cassiterite is coarse, at 0.3 to 3 mm grains and occasionally to 30 mm, hosted in closely spaced parallel quartz veins, so simple crushing and gravity separation makes a 56% tin concentrate.[R34] The surrounding Emmaville-Torrington district produced over 89,000 tonnes of tin concentrates on the same principle before the 1985 crash.[R34] Grain size, not head grade, decided which of these deposits could be processed economically, and Part 2 covers it. The state's other historic names, Ardlethan, Conrad and the Doradilla trend, complete the New South Wales entries in the register below.
9.00 — THE REGISTER
The master table
FIG. 11 is the full register. Provenance is marked per row. V means the figure was verified against the primary announcement or study. C means the figure is as cited by a third party and has not been independently re-verified. F means a historical entry flagged for verification. Historical production figures are records, not JORC Mineral Resource estimates.

SUPPORT SAMSO Independent, organic, and free to read We produce independent organic content and need your support to keep that going. Every contribution covers the cost of research, keeps the site running, and buys the time to write the next piece. A$10, A$20, A$30 or an amount you choose One time, weekly, monthly or yearly A donation buys nothing and unlocks nothing. It keeps the work going. |
10.00 — WHAT THE MAP SAYS
Reading the register
Three patterns are visible in the register.
First, the pipeline is tin, whatever the headlines say. Of the register's development-stage projects, Heemskirk, Taronga, the Mt Garnet skarns and the Herberton vein revival are all tin-led. Watershed is the one tungsten-led development. Of the three operating mines beyond Renison, all three, Mt Carbine, Dolphin and Kara, produce tungsten. Eastern Australia's operating mines produce mostly tungsten while its development pipeline is mostly tin.
Second, the policy framework treats the two metals differently. Tungsten is on Australia's Critical Minerals List of 31 minerals, eligible for the Commonwealth's critical-minerals financing, and appears on every major national critical list worldwide. Tin is on the separate Strategic Materials List, alongside copper and zinc, explicitly ineligible for that support, on the reasoning that its supply chain is not vulnerable enough.[R36] That judgement was made in December 2023. Tin has since traded to record prices with a third of world supply in doubt.
Third, head grade does not explain which deposits were developed. Taronga, at 0.10% tin, has a completed feasibility study. Windermere, at nearly three times that grade, has cassiterite too fine for X-ray diffraction to detect. Gilmore's ore ran 7.6% and paid for itself with 1930s technology. Gillian's 0.65% defeated a 2013 study backed by the world's largest tin producer. What separates these outcomes does not appear in a drill intersection. Part 2 covers it.


11.00 — REFERENCES AND SOURCES
Where every figure and claim in this article came from
Every figure and claim in this Insight is sourced below. Location maps (FIG. 01, 03, 08 and 09) are company figures reproduced from publicly released ASX documents, with the source credited in each caption. All other diagrams are original Samso illustrations of data and concepts from these references. Company figures are as at the announcement dates shown and market-sensitive numbers were current at the time of writing. Every entry below carries an identifier, [R1] to [R36], and the same identifier appears in the body text at the point that source is used.
[R1] Koba Resources Limited (ASX:KOB). RIU Sydney Resources Round-up presentation, ASX release 6 May 2026 (Herberton district history and tungsten production; Kitchener, Jiminy, Stannex, Gilmore data; tin market panel), and ASX announcement 7 October 2025, acquisition of the Stannary Hills and Mt Garnet Tin-Tungsten Projects from EV Resources (ASX:EVR).
[R2] Stellar Resources Limited (ASX:SRZ). Corporate presentation, May 2026, with underlying announcements: Heemskirk MRE (23 Feb 2026; 4 Sep 2023), Updated Heemskirk Scoping Study (3 Sep 2024), ore sorting (28 Jan 2025; 5 Aug 2025), metallurgy (9 Dec 2025; 22 Apr 2026), Metals X placement (30 Apr 2026), tin supply and producer data after the International Tin Association.
[R3] Tungsten Mining NL (ASX:TGN). Watershed PEE investor presentation, ASX release 22 June 2026, and announcement 18 June 2026 (updated MRE; study outcomes).
[R4] Vital Metals Limited quarterly reports (2017 to 2018), APT market commentary (high of US$335/mtu in 2017 against a ten-year average below that level).
[R5] Geological Survey of Queensland. North East Queensland Mineral Deposit Atlas, including Chapter 7, Mount Garnet Tin Deposits (dataset ds000065), and companion chapters on Wolfram Camp, Mt Carbine, Watershed and Herberton (ds000058).
[R6] Blake, D.H. (1972). Regional and economic geology of the Herberton-Mount Garnet area, Herberton Tinfield, North Queensland. BMR Bulletin 124. Wang, X. et al. (2024). Mineralization processes of the Mount Garnet Zinc deposit, NE Queensland. Ore Geology Reviews (Sn-W association with the O'Briens Creek Supersuite).
[R7] First Tin Plc (LSE:1SN). Results of Taronga Definitive Feasibility Study, RNS 2 May 2024 (New England orogen setting; district history).
[R8] Koba Resources Limited. Interim Financial Report for the half-year ended 31 December 2025, lodged 13 March 2026 (2,400+ historic mines; Kitchener Trend 5 km; binding agreement with EV Resources), and Stannary Hills project page (Atlanta Trend; drilling statistics).
[R9] Koba Resources website, Mt Garnet Tin-Tungsten Project page (Gilmore history to 193 m; Great Boulder production; 300+ historic mines within the project).
[R10] Finance News Network, 7 October 2025, reporting the Koba acquisition announcement (Gilmore 26,169 t at 7.6% Sn).
[R11] Consolidated Tin Mines Limited (ASX:CSD). Mt Garnet Tin Project PFS announcement, 30 September 2013, and Gillian DFS Update, 3 December 2015; combined skarn resource per the CSD disclosures as tabulated in Stellar Resources' peer benchmarking (May 2026). Vulcan production after Chang, Z. et al., An Overview of Sn-W Metallogeny in North East Queensland, as cited by Koba.
[R12] Koba Resources presentation, 6 May 2026, slides 12 to 14 (Stannex drilling and indium; Gilmore tungsten intercepts; district tungsten rock chips to 15.3% W; tungsten sampling program 2026).
[R13] Koba Resources presentation, 6 May 2026, slide 10 (Jiminy anomaly, never drill tested).
[R14] EQ Resources Limited (ASX:EQR). Mt Carbine project disclosures and corporate presentation; Wolfram Camp exploration targets (ASX, 7 Oct 2024); resource per EQR AGM presentation, 27 November 2025, as cited by Koba.
[R15] Mining Data Online, TMG Tin (Mount Garnet Tin) Project profile (Chillagoe Formation skarn geology; 2021 sale to Tablelands Mining Group), and Huntore Resources tenements page (deposit descriptions).
[R16] Askins, P.W. (1975). "Wrigglite", an unusual fluorite bearing skarn, Mount Garnet region, north Queensland. Unpublished MSc thesis, James Cook University, 135 p.
[R17] Stellar Resources corporate presentation, May 2026, Appendix 3 peer table (TMG Mt Garnet: 13.1 Mt at 0.39% Sn for 51.7 kt, per the CSD PFS announcement of 30 September 2013).
[R18] Huntore Resources, tenements page (Pinnacles 30 micron grind and fluorite flotation; Windermere cassiterite undetectable by XRD).
[R19] Aurora Metals Limited (formerly Consolidated Tin Mines), corporate history document (Kagara 2003; Snow Peak January 2013; asset acquisition April 2016; 2021 sale of the tin project and renaming), with MiningLink and Mining Weekly coverage (2013).
[R20] International Tin Association news archive: CSD items (27 Oct 2014; 13 May 2015) and Yunnan Tin cooperation (per MarketScreener, 21 Aug 2014).
[R21] Proactive Investors (30 Sep 2013) and Mining Weekly (1 Oct 2013): CSD Mt Garnet PFS results.
[R22] International Tin Association (10 Jul 2013): MGT Resources' first shipment of 17 t of 65% Sn concentrate from the refurbished Mt Veteran mill; Resources Roadhouse (11 Oct 2017) on Dalcouth drilling.
[R23] TOMRA Mining customer story, Mt Carbine (stockpile grades; sorter mass and recovery), and Australian Mining / Mining.com.au (3 June 2026: A$39M expansion; July 2026: Mt White acquisition and record A$79M quarterly sales).
[R24] EQ Resources corporate presentation PDF (historic ore sorting 1973 to 1986; ~50% WO₃ concentrate; tailings grade 0.072% WO₃).
[R25] Tungsten Mining NL: Watershed project page and ASX announcements 2 May 2018 (acquisition terms, A$15M cash, referencing the 2014 Vital Metals DFS) and 5 February 2026 (PEE commencement; resource restatement per Vital Metals, 4 July 2018).
[R26] Vital Metals Limited: Watershed DFS first reported 17 September 2014, updates 22 January 2015, 29 June 2015 and 22 January 2016; optimisation study 5 September 2017 (with Mining Weekly coverage).
[R27] Mining.com.au, "Can the West win the tin race?", March 2026 (Renison reserves at 31 March 2025 and December 2025 production record; Cleveland tungsten resource doubling and ore-sorting results; Metals X 2024 Annual Report production figures as cited by Stellar).
[R28] Critica Ltd, Mt Lindsay project disclosures as tabulated by Stellar Resources (May 2026).
[R29] Kwak, T.A.P. and Askins, P.W. (1981). Geology and genesis of the F-Sn-W(-Be-Zn) skarn (wrigglite) at Moina, Tasmania. Economic Geology 76(2), 439 to 467; Geotech International, Moina Project Summary, April 2020 (resource and metallurgical findings; figures predate current JORC reporting and should be read accordingly).
[R30] Group 6 Metals Limited (ASX:G6M), Dolphin project overview (history 1917 to 1992; reserve 4.43 Mt at 0.92% WO₃; commercial production 2023; 63% WO₃ concentrate target).
[R31] Premier of Tasmania, media release 10 February 2025 (A$10M loan-to-equity conversion), and Tasmanian Country coverage of the G6M FY2025 Annual Report (recapitalisation of more than A$81M of debt).
[R32] Australian Mining, July 2026 (Dolphin June 2026 quarter: 77,953 t processed, 21,297 mtu WO₃; underground mining commenced).
[R33] Tasmania Mines Pty Ltd website (Kara: producing since 1978; resources exceeding 20 Mt; planned life beyond 25 years; scheelite by-product markets), with skarn geology after Zaw, K. and Singoyi, B. (2000), Economic Geology 95(6).
[R34] First Tin Plc: Taronga DFS results (RNS, 2 May 2024) and Ore Reserves Statement (2024): resource 133 Mt at 0.10% Sn for 138.1 kt (MRE, Sept 2023, per the International Tin Association, which ranks it top-ten undeveloped globally); coarse cassiterite 0.3 to 3 mm; 56% Sn gravity concentrate; capex A$176M; 3,600 tpa over nine years; district production over 89,000 t of concentrates.
[R35] International Tin Association, 30 April 2026 (Taronga resource confidence: 71% Measured and Indicated; updated DFS in preparation).
[R36] Department of Industry, Science and Resources: Australia's Critical Minerals List and Strategic Materials List (updated 20 February 2024); Austrade Critical Minerals Prospectus notes (strategic materials ineligible for critical-minerals support); cross-country list comparison after A review of critical mineral resources in Australia, Australian Journal of Earth Sciences (2024).
Cover photo: PSM V37 D246 Sungei lembing tin mining district on the malacca peninsula, unknown author. Public domain, via Wikimedia Commons (https://commons.wikimedia.org/wiki/File:PSM_V37_D246_Sungei_lembing_tin_mining_district_on_the_malacca_peninsula.jpg). Reproduced photograph, shown faded under a navy overlay on the article thumbnail.
 The Samso Way – Seek the ResearchHere at Samso, we pride ourselves on delivering content for investors that is independent and informed by over three decades of experience in the industry. Our content is well-researched and is only created if I see merit in discussing the company's story. Our mission is simple. Cut through the noise and spotlight what matters. Genuine stories, grounded insights, and real opportunity. Investors can explore our four core platforms:
There may be numerous paths to success in investing, but the common thread among successful individuals is that they remain committed to making informed decisions. Equip yourself with the right knowledge and tools, and you will be well on your way to achieving your financial goals. Most importantly, investors need to be absolutely diligent in understanding their own risk-reward tolerance and capabilities. Never bite off more than you can chew. As they say, Rome wasn't built in a day, and the Great Wall stood because it took centuries to complete. The Samso Philosophy: Stay curious. Stay sharp. And remember, digging deeper always uncovers the real value. In Life, there is no such thing as a Free Lunch. Never bite off more than you can chew is my parting comment. Happy Investing, and the only four-letter word you need to know is DYOR. To support our independent work, please head over to our Support Page and give us a helping hand in any of the ways listed. This is a new initiative for the Samso Platform, and it was always the concept of Samso when we started this journey in 2018. DisclaimerThis article is general information only. It is not financial product advice and it does not take into account any reader's objectives, financial situation or needs. It contains no price targets, no valuations and no recommendation to buy, hold or sell any security. Companies named in this article are used as historical illustrations of events that have already occurred and no view is expressed on their current merits. Readers should consider obtaining advice from a licensed financial adviser and should conduct their own research before making any investment decision. Samso and its associates may hold interests in companies mentioned. About SamsoSamso is a trusted platform that equips dedicated investors with up-to-date industry knowledge and insights from top CEOs and thought leaders. By staying informed on business advancements and market trends, investors can enhance their financial decisions through a combination of expert guidance and their own research. The Investor's Playbook is an open-ended, evergreen educational series about how to think about investing rather than what to buy. Samso Insights | www.samso.com.au | An Investor Lens on ASX-Listed Companies |

Comments