The Scandium Story - A Small-Market Metal with Outsized Leverage in Lightweight Alloys and Clean-Energy Ceramics
- Noel Ong

- Apr 6
- 23 min read

Scandium (Sc) is one of those elements that rarely makes headlines, yet its influence cuts across some of the most important industrial and technological shifts underway today.
Despite a market that remains small in both scale and visibility, scandium’s unique properties - particularly its ability to strengthen aluminium alloys and enhance the performance of solid oxide fuel cells place it in a position of disproportionate strategic value.
The Source of Scandium
Scandium is rare, not as in crustal abundances but in substantial accumulations. Scandium-rich minerals are rare, there are only a dozen mineral species that are identified in the Earth's materials [13].
Today, we know that Scandium are commonly found in laterites. While laterites are commonly associated with REE (Sc belongs to the rare-earth elements (REE) group) and Sc, the concentration of the minerals is vastly different. and hence the accumulation of Sc is not easily discovered. It is important that not all lateritic profiles are rich in Scandium
Typically, scandium is commonly concentrated in lateritic regolith developed over mafic–ultramafic rocks. Concentrations reported in Australia, New Caledonia, the Caribbean, the Philippines, China, the Ivory Coast and Guinea reach 100 ppm in the Fe oxyhydroxide-rich horizons developed over peridotites[13].
In eastern Australia, exceptional concentrations, reaching 800 ppm [13] ´ have been recognised over mafic–ultramafic intrusions (Figure 1). I have to say that i did not know that Australia is a rich source of scandium which in the scheme of the scandium market, it does add to the fact that Australia is is now known to be a critical minerals powerhouse.

Figure 1: Location and geological context of the major lateritic Sc occurrences found in eastern Australia (1: Syerston–Flemington, site of study, 2: Hylea, 3: Owendale, 4: Nyngan, 5: Sconi, 6: Pacific Express). Scandium contents are given according to Byrne (2017); Gordon (2018); Moller et al. (2017); Ricketts and Duyvesteyn (2018); Bell (2018) and Durack (2018), respectively.
The Role of Laterites
Laterites are a major component of the CZ. These regolith result from intense subaerial weathering of rocks in tropical environments, forming alteration layers frequently reaching several tens of meters in thickness. Laterites occur over 30 % of the Earth continents and represent 80 % of the volume of the soil mantle, thus having a major influence on the geochemical budget of weathering (Nahon, 2003).

Like other regoliths, laterites result from the transfer of chemical elements between the different horizons of the CZ. However, the conditions in which laterites form are an extreme case of rock weathering.
What is Scandium?
Scandium is primarily found in two minerals, Thortveitite (ScYSi2O7) and Kolbeckite (ScPO4·2H2O), which do not occur in sufficient volumes to justify industrial mining. These minerals are located in Madagascar and the Iveland-Evje and Tørdal regions of Norway, but none of these deposits are currently being exploited. Typically, scandium is found in small, isolated pockets within pegmatite formations, making industrial extraction challenging, despite the fact that they yield beautiful mineral samples.

The primary source of scandium is secondary extraction from waste products following bauxite processing. A smaller amount is obtained from scandium mining and extraction from laterite soils. Deposits with industrial potential exist in China, Kazakhstan, Australia, the United States, and Russia.
In China, scandium is found in tin ores, tungsten ores, iron deposits, and Rare Earth Element deposits, while in Russia, it is associated with Rare Earth Element deposits and uranium mining. There is speculation about deep ocean deposits, though their extraction remains hypothetical.
Research is ongoing into other land resources. The Norwegian and Madagascan deposits are linked to gabbro and pegmatite formations but are not used for production. Currently, scandium is produced through calcio-thermic reduction of ScF3, obtained by fluorination of the oxide.
Utilising Scandium
The main way scandium is utilised is as a minor alloying element in aluminium, where even very small additions—typically less than 0.5%—can significantly enhance the metal’s strength, weldability, and resistance to heat and corrosion. This creates high-performance aluminium–scandium alloys that are lighter yet stronger than conventional materials, making them particularly valuable in aerospace, defence, and increasingly in advanced transport applications.

The role of scandium here is not about bulk consumption, but about performance enhancement—refining the grain structure of aluminium and stabilising it under stress. In practical terms, this allows manufacturers to reduce weight without compromising structural integrity, which translates directly into fuel efficiency, payload gains, and longer service life.

This article provides context for understanding the significance of scandium. Unlike iron ore or copper, its importance is not based on volume but on functionality and application. Scandium plays a crucial role in areas like aerospace-grade aluminum and new clean-energy ceramics, positioned at the crossroads of lightweight engineering and energy efficiency.
The challenge and opportunity with scandium arise from its scarcity, fragmented supply chains, and the ongoing attempts to commercialize its production from unconventional sources such as laterites, red mud, and other industrial by-products.

In this Samso Insight, we take a grounded look at where scandium sits today, how its market is developing, and why invest
Investors and industry participants are starting to pay closer attention. This is not about hype—it is about understanding a niche metal that may quietly underpin a range of future-facing technologies.
1.00 Uses of Scandium
The interesting fact about scandium is that the volume of use is extremely small per application (0.5% of Sc will triple the strength of Al alloys), however, it is used in a large amount of applications. For example, the typical aeroplane would use between 70 and 700kg of Sc oxide per plane, depending on the size of the aircraft. The main concept is that it will reduce the weight of aircraft by 10-15% and hence reduce operating cots significantly. There are also narratives pointing to the use of scandium in solid oxide fuel cells.
1.01 Aluminium–Scandium Alloys (weight, strength, weldability)
Scandium’s most cited industrial role is as an alloying element in aluminium. Even small additions can materially improve alloy performance, which is why scandium repeatedly appears in aerospace and high-performance manufacturing conversations.
Where it shows up most often (end-use themes) in Figure 2:
Aerospace & defence components where strength-to-weight matters
Additive manufacturing (3D printing) alloy development for high-performance parts
Select sporting goods and niche lightweight applications

Figure 2: Why Al-Sc Alloys Matter (source: Samso)
1.02 Solid Oxide Fuel Cells (SOFCs) and energy ceramics
Another major demand driver discussed in technical and industry sources is scandium’s use in SOFC-related ceramics (often referenced as scandia-stabilised materials) (Figure 3). This is one reason demand discussions frequently point toward clean-energy systems and stationary power.

Figure 3: Scandium-Containing Ceramics in Solid Oxide Fuel Cells (SOFCs). (source: Samso)
1.03 Specialty uses (lasers and niche tech)
Older United States Geological Survey (USGS) reporting groups scandium end uses into Al-Sc alloys, fuel cells, and lasers, which is a neat way to remember the “big three” buckets (Figure 4).
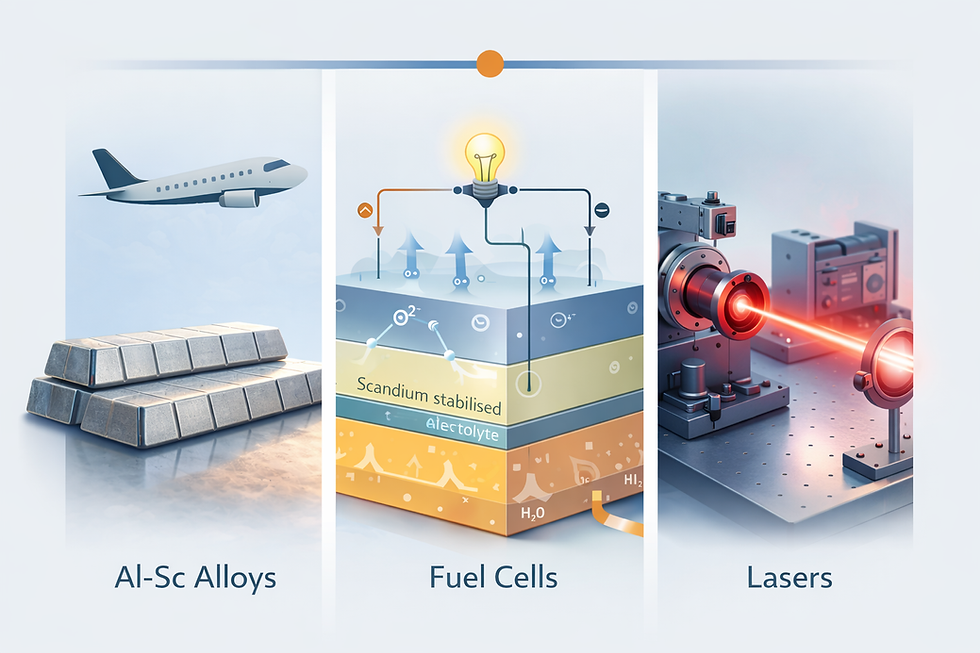
Figure 4: Applications of scandium in industry (source: Samso)
2.00 Global Market Facts (what’s real, what’s small)
2.01 The market is small in tonnage
USGS has repeatedly characterised scandium as a small market, with industry estimates indicating global production was less than 40 tonnes in 2022.
USGS yearbook-style reporting has also put global consumption around ~15–25 tonnes per year (noting uncertainty and limited transparency).
More recent reporting (Reuters, September 2025) described global scandium oxide production at about 40 tonnes in 2024 (Figure 5).

Figure 5: Scandium Market Scale bar chart: 2022 (<40 t) vs 2024 (~40 t) with source notes. (source: Samso)
Samso take: This is the key feature, not a footnote. In a market measured in tens of tonnes, a single credible project can change the supply narrative.
2.02 Price and market-size reports vary widely
Commercial market reports publish market-value forecasts, but the numbers differ by methodology and definitions (metal vs oxide vs total value chain). Treat these as directional, not gospel.
3.00 Global Producers - Who actually make scandium
Global scandium supply is highly concentrated, with China dominating both primary production and virtually all refined metal output. This lack of diversified supply underscores the structural tightness of the scandium market and elevates supply-chain risk for downstream users (Figure 6).

Figure 6: Scandium Supply Dominance by Location (source: Samso)
Scandium is rarely produced from primary mines, with supply largely dependent on by-product recovery (Figure 7).

Figure 7: Conceptual Scandium Supply Chain Pathway (source: Samso)
3.01 China, Russia, Ukraine (commonly cited sources)
Official and policy-style commentary often points to China, Russia, and Ukraine as key sources in the historical supply narrative.
3.02 Rio Tinto (Canada, titanium dioxide waste stream route)
Reuters reported that Rio Tinto developed a method to extract high-purity scandium oxide from titanium dioxide production waste, with capacity reported at up to ~3 tpa at its Quebec facility since 2022.
3.03 Emerging Western stockpiling interest (signal, not volume)
Reuters also reported the U.S. Defense Logistics Agency’s intent to buy scandium oxide for stockpiles, including a first-year target described as nearly 2 tonnes, framed as about ~5% of global production (based on the same reporting).
4.00 Global Scandium Consumption - How many tonnes, and who uses it
The cleanest “tonnes” statement in public, citable sources is the USGS estimate range:
Global consumption is estimated at ~15–25 tonnes per year (yearbook reporting).
And production context from USGS MCS:
<40 tonnes produced in 2022 (industry estimates cited by USGS).
Consumption buckets (consistent framing) (Figure 8):
Aluminium-scandium alloys
Solid oxide fuel cells
Lasers and niche tech

Figure 8: Indicative Scandium End-Use Applications (source: Samso)
5.00 What industries are using scandium?
(Figure 9)
5.01 Aerospace & Defence
This is the most visible narrative driver because lightweight alloys have obvious platform benefits, and because strategic supply is now being discussed in policy/stockpile terms.
5.02 Clean Energy (SOFC-related)
SOFC demand is repeatedly cited as a growth vector in USGS-style summaries and technical literature.
5.03 Advanced manufacturing (incl. alloy development and additive pathways)
NioCorp/Lockheed reporting highlights scandium-aluminium alloy development linked to defence manufacturing and 3D printing workflows (processing into powder for additive manufacturing was specifically described).

Figure 9: Scandium End-Use Industries and Supply Constraints (source: Samso)
6.00 Australia’s Core Scandium Province : New South Wales
(Figure 10)

Figure 10: Australia’s Scandium hotspot (source: OzMin database, Geoscience Australia)
New South Wales has emerged as Australia’s most concentrated and strategically important scandium province—often described as Australia’s scandium hotspot, or the “Kalgoorlie of Scandium” as it hosts projects that span the full development spectrum from exploration to advanced, construction-ready assets (Figure 10). The clustering of these projects within a single jurisdiction highlights both the region’s geological endowment and the growing strategic relevance of scandium as a constrained, high-value metal.
Key contributors to the New South Wales scandium story include:
Sunrise Energy Metals Limited (SRL): Advancing the Syerston Project as a primary scandium development, supported by significant recent funding and a defined pathway toward construction.
Scandium International Mining Corp (SCY): Owner of the Nyngan Scandium Project, one of the most advanced standalone scandium assets globally, with completed feasibility work and permitting in place.
Rimfire Pacific Mining Limited (RIM): Providing district-scale exploration exposure across the Fifield region, with defined resources and exploration targets that offer longer-dated scandium optionality.
Together, these companies frame New South Wales as the backbone of Australia’s scandium narrative, combining near-term development potential with longer-term exploration upside in a market defined by limited and highly concentrated global supply.
6.10 Sunrise Energy Metals (ASX: SRL) – Syerston (NSW)
Flagship asset: Syerston Scandium Project, New South Wales (Figure 11)

Figure 11: Syerston Scandium Project, New South Wales (source: SRL)
Scandium focus: Primary scandium development (not by-product based)
Project status: Advanced development; pre-construction activities underway
Funding position: ~A$105 million raised since June 2025, including a A$32.5 million placement announced in December 2025
Development timeline: Targeting on-site construction by mid-2026, subject to approvals
Strategic angle: Positioned as a large, Western scandium supply source outside China
End-use exposure: Aluminium-scandium alloys, solid oxide fuel cells, defence alloys, semiconductors
6.11 The Business of Sunrise Energy Metals Limited – The Syerston Project, New South Wales
The Syerston Project is a long-evolving asset centres around a laterite deposits that has been focused on nickel, then nickel-cobalt and no Scandium. The chemistry and the mix of potential commodities have not changed. It is now and has always been about what is the market requirements at the time of discussion.
The deposit was first identified in the 1990s during regional exploration programmes targeting nickel laterites in New South Wales. Early work defined a large, low-grade but laterally extensive nickel–cobalt resource developed over ultramafic rocks. At that time, the focus was primarily on nickel, with cobalt recognised as a secondary component and scandium largely overlooked.
Through the late 1990s and early 2000s, the project underwent systematic drilling, metallurgical testing, and resource definition. This work established Syerston as one of the more significant laterite deposits in Australia, but like many laterite projects globally, its development was constrained by processing challenges and fluctuating nickel prices. The complexity and cost of high-pressure acid leach (HPAL) processing meant that advancing the project required both technical confidence and strong market conditions.
The project later came under the control of Clean TeQ Holdings Limited, which marked a turning point in its development. Under this ownership, Syerston was repositioned from a conventional nickel project into a more integrated nickel–cobalt–scandium development. This period saw significant investment in metallurgical innovation, including proprietary ion exchange and purification technologies aimed at improving recoveries and product quality.
It was also during this phase that scandium became a more prominent part of the story. As global interest in scandium’s applications—particularly in aluminium alloys and solid oxide fuel cells—grew, Clean TeQ began to highlight Syerston as one of the few deposits globally capable of supplying scandium at scale as a by-product.
By the mid to late 2010s, the project had progressed through feasibility-level studies, positioning it as a potential large-scale supplier of battery materials. However, like many capital-intensive projects, timing became a key factor. Market conditions, financing requirements, and evolving battery supply chain dynamics influenced the pace at which development could proceed.
In 2021, Clean TeQ Holdings rebranded to Sunrise Energy Metals Limited, reflecting a broader strategic focus on clean energy metals and aligning the company more clearly with the battery materials and energy transition narrative.
From a Samso perspective, the history of Syerston is a reminder that large laterite projects are not built overnight. They evolve over decade, moving from discovery, through technical validation, and into the more challenging phase of commercial execution. The work done over the years has de-risked many aspects of the project, but the key question remains the same: how effectively that long history can now translate into a producing operation.
6.20 Scandium International Mining Corp (TSX: SCY) – Nyngan Scandium Project (NSW)
The Nyngan Scandium Project, owned by Scandium International Mining Corp, is one of the most advanced primary scandium development projects globally. Located approximately 20 km west of Nyngan in central New South Wales, the project benefits from established infrastructure, including road access, rail connectivity, power, and proximity to regional service centres.
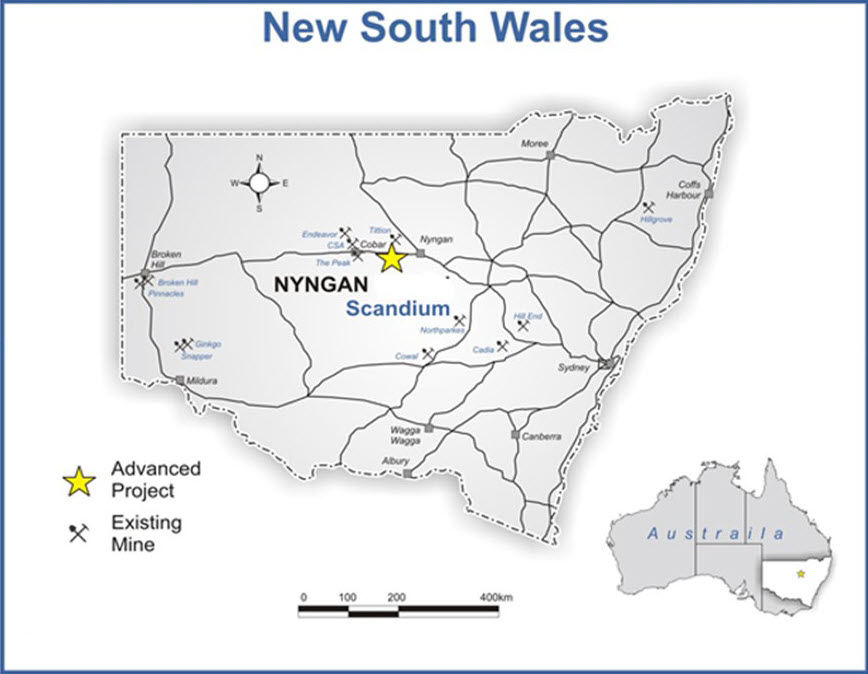
Figure 12: Nyngan Scandium Project, New South Wales (source: SCY)
The deposit is hosted within a lateritic profile developed over mafic rocks. The mineralisation is near-surface, laterally continuous, and amenable to open-pit mining. What differentiates Nyngan is the relatively high scandium grade compared to typical laterite systems, where scandium is usually a minor by-product. Here, scandium is the main economic driver.
Definitive Feasibility Study (source: Scandium Mining)
During May 2016 the Company issued a National Instrument NI 43-101 Technical Report entitled "Feasibility Study - Nyngan Scandium Project". The feasibility study was independently prepared; Lycopodium Limited led the feasibility study team from their Brisbane, Australia office.
Feasibility Study Highlights:
Capital cost estimate for the Project is US$87.1 million,
Operating cost estimate for the Project is US$557/kg scandium oxide,
Oxide product volume averages 37,690 kg per year, over 20 years,
Project Constant Dollar NPV10% is US$177 million, (NPV8% is US$225 million),
Project Constant Dollar IRR is 33.1%,
Oxide product grades of 98-99.9%, as based on customer requirements,
Project resource increases by 40% to 16.9 million tonnes, grading 235ppm Sc, at a 100ppm cut-off in the measured and indicated categories, and
Project Reserve totalling 1.43 million tonnes, grading 409ppm Sc was established on part of the resource.
The feasibility study concludes that the Project has the potential to produce an average of 37,690 kilograms of scandium oxide (scandia) per year, at grades of 98.0%-99.9%, generating an after tax cumulative cash flow over a 20 year Project life of US$629 million, with an NPV10% of US$177 million. The feasibility study has been developed and compiled to an accuracy level of +15%/-5%, by a globally recognized engineering firm with considerable expertise in laterite deposits.
A number of the key elements of this flowsheet work have been protected by the Company under US Patent Applications.
Positioning The Nyngan Project – A Primary Scandium Resource
The Nyngan Project is established as a primary scandium supplier, distinguishing itself from those relying on by-product production. This is a significant differentiation.
The strategy focuses on supplying scandium for:
Aluminium–scandium alloys (used in aerospace, transport, and additive manufacturing)
Solid oxide fuel cells (for clean energy applications)
Given the relatively small size of the scandium market, the project is designed to produce modest annual volumes that match current and anticipated demand growth. Scandium is a high value product which is a rare business in mining. Figure 12a gives a good comparison of pier projects.

Figure 12a: Scandium project comparisons. (source: Scandium Mining)
Another advantage that Nyngan has is an extablished mining jurisdiction with access to road and rail. Easy avalability of skilled workers is very important. Readers have to remember that the proejct is decades in the making and with the market as it is now with all the geopolitical issues and the current hostilities in the Middle-East, timing for a "boutique" commodity like Scandium may have founds it day of rewars in 2026.
6.30 Rimfire Pacific Mining Limited (ASX: RIM) – Fifield Scandium District (NSW)
Scandium focus: District-scale scandium exploration in the Fifield Scandium District, New South Wales (Figure 13).

Figure 13: Fifield Scandium District, New South Wales (source: RIM)
Strategic position: Controls a large scandium-prospective landholding in Australia’s premier scandium province
Key projects: Murga, Melrose, Currajong, Rabbit Trap, and Forrest View, located proximal to Sunrise Energy Metals’ Syerston Project
Resource base: Maiden and updated JORC Mineral Resource Estimates defined at Melrose, Murga North, and Currajong, with combined contained scandium oxide reported across multiple deposits
Exploration upside: Murga Exploration Target of 100–200 Mt at 100–200 ppm Sc, highlighting potential for material resource growth, subject to further drilling and conversion to MRE
Development pathway: Near-term focus on infill air-core drilling and conversion of exploration targets to mineral resources, with a stated target of new MRE updates by Q1 2026
Strategic context: Operates alongside major and emerging scandium players in Fifield, including Sunrise Energy Metals and Rio Tinto, reinforcing district-scale significance
Rimfire Pacific Mining Limited is positioning itself as a district-scale explorer and developer within the Fifield region of central New South Wales. The strategy is based on consolidating a landholding across what is emerging as a significant scandium province.
The company controls a large tenement package in the Fifield area and is advancing multiple scandium prospects alongside exposure to gold, antimony, and copper targets .
The Fifield Projects – A Cluster of Scandium Opportunities
According to the latest presentation, Rimfire’s core focus is within the Fifield district, which hosts multiple scandium projects in close proximity to each other and to established deposits.
The geology is consistent across the region:
Laterite-hosted mineralisation
Developed over pyroxenite source rocks
Broad, near-surface mineralised zones
The company’s key projects in the district include:
Murga Scandium Project
Melrose and Currajong deposits
Rabbit Trap Project (recently acquired 100%)
This cluster approach suggests the potential to build regional scale rather than a single standalone operation.
7.00 Global supply risk and why scandium keeps showing up in strategic lists
Two facts keep repeating across credible sources:
Scandium is dispersed and typically produced as a by-product, limiting scalability
Western policy and defence procurement interest is rising (stockpiling and offtake headlines)
This is why scandium periodically “pops” into investor attention. Not because it is a bulk commodity, but because it is the opposite.
8.00 Scandium Pricing – A Niche Market Defined by Scarcity and Function
Scandium pricing is fundamentally different from most commodities. There is no transparent exchange, no daily spot price, and very limited publicly reported transactions. Instead, pricing is typically negotiated through private contracts, often tied to purity, volume, and end-use application.
The indicative pricing ranges are:
Scandium Oxide (Sc₂O₃): ~US$1.2M to US$3.8M per tonne
Scandium Metal (ingot): ~US$134M to US$153M per tonne
High-purity dendritic scandium metal: up to ~US$233M–US$513M per tonne
Readers will have figured out that these numbers highlight that this market is not about volume. Pricing reflects extreme scarcity and high performance value, not market liquidity.
![Figure 14: (a) Reconstructed total production rate for scandium in ton per year. The data was pieced together from the referenced literature and different websites. Squares represent estimates by the authors from corporate websites and articles in the reference list. (b) Approximate data corridor for the price for scandium oxide (Sc2O3). All curves based on approximate data gathered by the authors [20]. (c) The metal price in $/kg as it appears in the United States Geological Survey, Minerals Commodities Summaries from the years 1996–2023.](https://static.wixstatic.com/media/8d6c37_10a92d3ffbe042af826161a0f6597619~mv2.jpg/v1/fill/w_980,h_297,al_c,q_80,usm_0.66_1.00_0.01,enc_avif,quality_auto/8d6c37_10a92d3ffbe042af826161a0f6597619~mv2.jpg)
Figure 14: (a) Reconstructed total production rate for scandium in ton per year. The data was pieced together from the referenced literature and different websites. Squares represent estimates by the authors from corporate websites and articles in the reference list. (b) Approximate data corridor for the price for scandium oxide (Sc2O3). All curves based on approximate data gathered by the authors [20]. (c) The metal price in $/kg as it appears in the United States Geological Survey, Minerals Commodities Summaries from the years 1996–2023.
I discovered an excellent paper [20], illustrated in Figure 14. The three charts clearly explain the production matrix and pricing of Scandium in both its oxide and metal forms. Figure 14 (a) displays the reconstructed production rate for scandium in tons per year. The data in Figure 14 was compiled from referenced literature and various websites. According to [20] there is limited published material on scandium, and the data is often inconsistent or incomplete. The squares indicate estimates by the authors.
The circular marker in Fig. 14 (a) represents the projected rate for 2030 if various projects in the United States, Canada, and Australia are realized. These new production projects are currently underway.
Figure 14 (b) illustrates the approximate price level for scandium oxide (Sc2O3). The prices from different sources vary significantly at the same time, so we have defined a range where the price is most likely to be found for both metal and oxide.
Figure 14 (c) shows the metal price in $/kg as reported in the United States Geological Survey's Minerals Commodities Summaries from 1996 to 2023, with data for 1996–2019 [14]. After 2019, the USGS does not regularly update the figures.
![Figure 15: Data for scandium contents in bauxite used for scandium extraction in Russia [21]. Such data, was used in constructing Figure 17 and 18](https://static.wixstatic.com/media/8d6c37_afa3e43f8e4e4bbfb1965043610e8e4d~mv2.jpg/v1/fill/w_819,h_791,al_c,q_85,enc_avif,quality_auto/8d6c37_afa3e43f8e4e4bbfb1965043610e8e4d~mv2.jpg)
Figure 15: Data for scandium contents in bauxite used for scandium extraction in Russia [21]. Such data, was used in constructing Figure 17 and 18
The authors [20] compiled the price data in the diagrams from the cited literature and various websites (Fig. 15). (source: [20]). Figure 16 below presents estimates of scandium production volumes in 2022, assisted by educated guesses. Approximately 65% of the total volume is utilized as metal for alloys. The rate of scandium recycling is unknown, as no figures are available in any of the references.
![Figure 16: Shows the resource estimates for scandium as done by the authors. For Rare Earth Element deposits there are some more data points and the contents vary a lot, from as low as 26 ppm to more than 110 ppm in India and China, other locations have averaged at 220–400 ppm, but some deposits may have as much as 2000 ppm. (source: [20]](https://static.wixstatic.com/media/8d6c37_78c3002c5490463ab107299e9422104d~mv2.jpg/v1/fill/w_980,h_756,al_c,q_85,usm_0.66_1.00_0.01,enc_avif,quality_auto/8d6c37_78c3002c5490463ab107299e9422104d~mv2.jpg)
Figure 16: Shows the resource estimates for scandium as done by the authors. For Rare Earth Element deposits there are some more data points and the contents vary a lot, from as low as 26 ppm to more than 110 ppm in India and China, other locations have averaged at 220–400 ppm, but some deposits may have as much as 2000 ppm. (source: [20]
In Figure 17, the data shows the resource estimates for scandium as done by the authors [20]. For Rare Earth Element deposits there are some more data points and the contents vary a lot, from as low as 26 ppm to more than 110 ppm in India and China, other locations have averaged at 220–400 ppm, but some deposits may have as much as 2000 ppm.
![Figure 17: Results for resource basis for scandium production. The above shows the approximate scandium production potentials from the different possibilities. Production estimated from mother metal production rates and assumed average scandium content at present as estimated by the authors. (source: [20])](https://static.wixstatic.com/media/8d6c37_a76511f01b764c92b59ec5c58e60f6d9~mv2.jpg/v1/fill/w_980,h_316,al_c,q_80,usm_0.66_1.00_0.01,enc_avif,quality_auto/8d6c37_a76511f01b764c92b59ec5c58e60f6d9~mv2.jpg)
Figure 17: Results for resource basis for scandium production. The above shows the approximate scandium production potentials from the different possibilities. Production estimated from mother metal production rates and assumed average scandium content at present as estimated by the authors. (source: [20])
Single deposits have significantly higher contents in smaller sections of the ore bodies. The research does highlight that none of this is geostatistically representative for whole regions, and only represents single random samples. Thus, the data is tentative. The available data and information has been used to make educated guesses. The estimated yields are very variable.
![Figure 18: Results for resource basis for scandium production. (source: [20])](https://static.wixstatic.com/media/8d6c37_51adae78a74a4b4186e7f8f510e8fdad~mv2.jpg/v1/fill/w_980,h_381,al_c,q_85,usm_0.66_1.00_0.01,enc_avif,quality_auto/8d6c37_51adae78a74a4b4186e7f8f510e8fdad~mv2.jpg)
Figure 18: Results for resource basis for scandium production. (source: [20])
Figure 18 illustrates the estimated scandium production potentials from various sources. These estimates are based on current mother metal production rates and the assumed average scandium content, as determined by the authors.
8.10 Historical Pricing – Why It Has Been Volatile
Unlike bulk commodities, scandium pricing has not followed a smooth supply-demand curve. Instead, it has moved in steps, largely driven by availability rather than consumption growth.
8.11 Early Market (Pre-2000s) – Experimental and Illiquid
Scandium was primarily produced as a by-product from uranium and rare earth operations (mainly in the former Soviet Union).
Supply was inconsistent and volumes were extremely low.
Pricing was opaque and largely irrelevant to broader markets.
8.12 2000s to Early 2010s – First Commercial Interest
Growing awareness of scandium in aluminium alloys and fuel cells.
Limited supply kept prices high, often above US$2,000–$5,000 per kg for oxide.
Market remained constrained due to lack of reliable producers.
8.13 Mid-2010s – Supply Expansion Attempts
Projects like Nyngan (Australia) and others globally began advancing.
Some increased supply (including Chinese production) led to price softening, but not collapse.
The key issue remained: supply was still inconsistent and not scalable.
8.14 Late 2010s to Early 2020s – Stabilisation Phase
Prices generally stabilised within a broad band, reflecting:
Limited but steady supply (largely from China)
Slow but growing adoption in niche applications
The market remained thin and sensitive to small changes in supply.
8.15 Current Phase (2020s) – Strategic Metal Narrative
Renewed interest driven by:
Light weighting (aerospace, transport)
Clean energy (SOFCs, hydrogen systems)
What is SOFCs ?
Solid Oxide Fuel Cells (SOFCs) are high-efficiency electrochemical devices that convert fuel (hydrogen, natural gas, biogas) directly into electricity and heat without combustion. They operate at high temperatures (–) using a solid ceramic electrolyte to move oxygen ions, allowing for high fuel flexibility and the use of non-precious catalysts.
Advanced electronics (AlScN materials) -
What is AIScN ?
Aluminium Scandium Nitride (AIScN) is an advanced wurtzite-structured ferroelectric material, commonly called scandium-doped aluminum nitride, that boosts the piezo-electric properties of Aluminium Nitride (AIN). Primarily used in 5G RF filters, non-volatile memory, MEMS, and photonics, (ASIcN) offers high temperature stability (over 600°C) and superior piezoelectric coefficients
Pricing remains high due to:
Concentrated supply (China dominance)
Lack of large-scale Western production
Increasing strategic importance
8.20 What Drives Scandium Prices Today
The research has come up with some pointed factors indicates that the scandium pricing is driven by a small number of key factors:
8.21 Supply Availability
Small increases in supply can have a disproportionate impact on price
Lack of new projects keeps pricing elevated
8.22 Product Purity
High-purity scandium oxide commands premium pricing
Metal form (especially dendritic) can reach extreme values due to processing complexity
8.23 End-Use Applications
Aerospace and defence applications tolerate higher pricing
Emerging sectors (fuel cells, semiconductors) are sensitive to cost but require reliability
8.24 Contract-Based Market
Long-term offtake agreements often dictate pricing
No liquid spot market means price discovery is limited
8.30 The Key Insight – Why Pricing Has Not Collapsed
One of the most important observations is that scandium prices have remained high despite low overall demand.
The market has never had enough reliable supply to test true demand elasticity.
In other words:
Prices are high because supply is scarce
Demand is limited because prices are high
One would wonder if this is good for producers and the market. The situation is like it is a feedback loop that has kept the market small.
Samso Concluding Comments
The first time I came across Scandium would have been almost 20 years ago. I was asked to give my opinion and the feedback I gave was that it was difficult and the market was extremely small. If I am not mistaken, the price of the metal was just as attractive but the market was and is still as opaque and I am not sure if the marketability for the metal is any easier.
Like manganese and the iron ore market, when it was first a market, in the 1960s, the project is only successful if you have a buyer. There is not much concept of an open market although, the likes of manganese and iron ore is a lot easier now. I was recently in a similar market and that was High Purity Quartz. The pricing mechanism was very lucrative but with research, the market is complex and very specialised.
In some ways, like the general thought for High Purity Quartz, assuming this is true, the geological nature is what dictates the lack of economical sources. Scandium has a hard time trying to concentrate in an economical amount and that may also be why it is priced so handsomely. The ability to get the metals in a economically mineable source appears to be challenging and one would think that this issue is here to stay.
The other aspect is not just a lack of an economical source, the use of the metals is also small and that means the production required is not that high. Like tungsten, the global consumption is only 100,000 plus per annum. Although, with the increasing amount of hostilities recently, the need for tungsten to replenish used missiles etc. may move that needle a bit more.
If you look back at Figure 14 and Figure 15, the projections are all suggesting bigger numbers in the future and if we take into consideration that we are moving into a new form of energy use, emission control and a new way of regulating energy, the need for these boutique metals will surely be in demand.
I guess, for Australia, the amount of sources coming out of New South Wales may make Australia the Mecca of Scandium and at a time when the term "Critical Minerals" is taking centre stage in a global manner, this will be a fortunate geological phenomenon.
References:
United States Geological Survey (USGS) – Mineral Commodity Summaries (MCS): Scandium (2024, 2025)
USGS – Rare Earths Minerals Yearbook (2019) (includes scandium end uses and consumption estimate range)
Geoscience Australia – Australian Resource Reviews: Scandium
Reuters – U.S. DLA scandium oxide purchase / Rio Tinto supply (Sept 22, 2025)
Reuters – Sunrise–Lockheed scandium option (Oct 23, 2025)
Financial Times – broader context on Pentagon stockpiling push
USITC executive briefing – Russia and scandium background
NSW Government appendix (historic directory context for NSW projects)
Scandium International Mining Corp Corporate Presentation - October 2022
Chassé, Mathieu & Griffin, William & O’Reilly, Suzanne & Calas, Georges. (2019). Australian Laterites Reveal Mechanisms Governing Scandium Dynamics in the Critical Zone. Geochimica et Cosmochimica Acta. 260. 292-310. 10.1016/j.gca.2019.06.036.
Nahon D. (2003) Weathering in Tropical Zone. Significance Through Ancient and Still Active Mechanisms. Comptes Rendus - Geosci. 335, 1109-1119.
Byrne J. (2017) Annual Report. Technical report, Jervois Mining Ltd, Howthorn, Vic., Australia.
Gordon M. (2018) Riva Resources Limited. Technical report, Independent Investment Research (Aust.) Pty Limited, Sydney, NSW, Australia.
Moller B., Mosig R. and Hartley C. (2017) Annual Report. Technical report, Platina Resources Limited, Mt Hawthorne, WA.
Ricketts N. J. and Duyvesteyn W. P. C. (2018) Scandium Recovery from the Nyngan Laterite Project in NSW. In Light Met. 2018. TMS 2018. Miner. Met. & Mater. Ser. (ed. O. Martin). Springer, Cham, Switzerland. pp. 1539–1543.
Durack S. (2018) Six High-Grade Cobalt-Scandium Areas Key Focus at Granted NSW Tenement. Technical report, MinRex Resources Limited, Perth, WA.
Bell B. (2018) Quarterly Activities Report. Technical report, Australian Mines Limited, Perth, WA.
Sverdrup, Harald & Sverdrup, Antoniy. (2024). On the Supply Dynamics of Scandium, Global Resources, Production, Oxide and Metal Price, a Prospective Modelling Study Using WORLD7. Biophysical Economics and Sustainability. 9. 10.1007/s41247-024-00118-y.
Boyarintsev AV, Aung HY, Stepanov S, Shoustikov AA, Ivanov PI, Giganov G (2022) Evaluation of main factors for improvement of the scandium leaching process from Russian bauxite residue (Red mud) in carbonate media. Am Chem Soc Omega 7:259–273
The Samso Way – Seek the Research
Here at Samso, we pride ourselves on delivering content for investors that is independent and informed by over three decades of experience in the industry. Our content is well-researched and is only created if I see merit in discussing the company's story.
Our mission is simple: cut through the noise and spotlight what matters—genuine stories, grounded insights, and real opportunity.
Our content is well-researched and is only created if the team sees merit in discussing the company or concept. Investors can explore our three core platforms:
There may be numerous paths to success in investing, but the common thread among successful individuals is that they remain committed to making informed decisions. Equip yourself with the right knowledge and tools, and you will be well on your way to achieving your financial goals.
Most importantly, investors need to be absolutely diligent in understanding their own risk-reward tolerance and capabilities. Never bite off more than you can chew. As they say, Rome wasn’t built in a day, and the Great Wall stood because it took centuries to complete.
The Samso Philosophy:
Stay curious. Stay sharp. And remember—digging deeper always uncovers the real value.
In Life, there is no such thing as a Free Lunch.
Never bite off more than you can chew is my parting comment.
Happy Investing, and the only four-letter word you need to know is DYOR.
To support our independent nature of our work, please head over to our Support Page and give us a helping hand in any of the ways listed. This is a new initiate for the Samso Platform, and it was always the concept of Samso when we started this journey in 2018.
Disclaimer
The information or opinions provided herein do not constitute investment advice, an offer, or solicitation to subscribe for, purchase, or sell the investment product(s) mentioned herein. It does not take into consideration, nor have any regard to your specific investment objectives, financial situation, risk profile, tax position and particular, or unique needs and constraints.
Share to Grow: Your Bonus
Samso has just released an eBook: How to Add Value to your Share Portfolio
A lesson on geological models sought by mining companies that gives insight and an understanding of which portfolios are better - and potentially more lucrative – investments. Click here to download this eBook.

If you find this article informative and useful, please help me share the information. I try to write about topics that are interesting and have the potential to be of investment value. It is not easy to find stories that fit those parameters. If you or your organisation sees the benefit of what Samso is trying to achieve and has a need to share your journey, please contact me at noel.ong@samso.com.au.
Samso is a trusted platform that equips dedicated investors with up-to-date industry knowledge and insights from top CEOs and thought leaders. By staying informed on business advancements and market trends, investors can enhance their financial decisions through a combination of expert guidance and their own research.


Comments