
The Dilemma of Investing in the Iron Ore Story

Updated: 2 days ago
The iron ore market is splitting in two. The product that pays today's dividends, 62% Fe fines (62% iron content) into Chinese blast furnaces, carries a softening price outlook on every published forecast. The product with the strongest structural story, high-purity magnetite feed for direct-reduction steelmaking, sits mostly in projects that are the hardest to finance. That is the dilemma.
This Insight lays out both sides, maps the exposure on the Australian Securities Exchange (ASX), and closes not with a directive but with the what-ifs a reader needs to think through for their own path.

Samso Insights | Investor Awareness | Commodity Series | Samso Market Strategy |
WHAT THIS PIECE COVERS Two markets hiding inside one commodity. A controlled softening rather than a collapse. What DR grade actually means, and what it does not. Real growth, with uncertain timing. What the premium is, and what it is not. Mega Hubs, briquettes, and a warning sitting inside an opportunity. What all of this means on the Australian market. 8.00 HOW TO READ A MAGNETITE STORY Six layers to work through before putting a value on anything. Why this Insight ends without a tip, on purpose. Every figure and claim, sourced. |
1.00 — THE DILEMMA
Two markets are hiding inside one commodity
For thirty years the iron ore story has been a single sentence: dig haematite in the Pilbara, ship it to China, collect the margin. That sentence built the largest export industry Australia has ever had. It is now becoming two different sentences, and they point in different directions.
The first market is bulk iron units: products grading 58% to 62% Fe that feed conventional blast furnaces (BF). It remains enormous, and it will not disappear. But its marginal pricing is set by declining Chinese steel output, a weak Chinese property sector, and a wave of new supply from Simandou in Guinea, Brazil and Australia itself. The Australian Government's June 2026 Resources and Energy Quarterly (REQ) expects iron ore export earnings to fall from A$117 billion in 2025-26 to A$77 billion in real terms by 2030-31.
The second market is premium low-gangue iron units for direct-reduction (DR) steelmaking: 65% Fe fines, DR-grade pellet feed, DR pellets, briquettes and eventually hot briquetted iron (HBI), the feed that DR plants and electric-arc furnaces (EAF) need. Gangue is the waste material in ore, mostly silica and alumina, and in an electric furnace it does not burn away. It becomes slag, consumes electricity and destroys productivity. That is why direct-reduction customers pay for purity, not just for iron.
The tension in this Insight's title sits between those two markets. The companies with the safest cash flows are concentrated in the first one, which has the weakest price trajectory. The strongest structural growth story belongs to the second, yet most of the vehicles offering exposure to it are development projects that need billions of dollars, years of approvals and customer qualification programs that can outlast an investor's patience. The superior product does not automatically produce the superior investment.

FIG. 01 below maps where the assets behind both markets sit, from the Labrador Trough, Sweden and the Gulf to the Australian register that Section 7 works through in detail.

2.00 — WHERE THE PRICE SITS
A controlled softening, not a collapse
At the time of writing, mid-July 2026, the benchmark price for 62% Fe fines delivered into China, quoted on a CFR basis (cost and freight, meaning the price includes ocean shipping to the destination port), is trading at approximately US$100 to US$105 per tonne, having dipped briefly below US$100 in late June before recovering. That is a healthy price for the big, low-cost Australian producers, whose average cash costs the Australian Government estimated at roughly US$33/t in 2025, before sustaining capital, royalties, freight and corporate costs.
The forecasts, set out in TABLE 01, all lean the same way. One note on the pricing bases in the table: CFR prices include ocean freight to the destination, while FOB (free on board) prices are quoted at the export port and exclude the ocean freight leg.


The decks are a base case, not a guarantee. Chinese stimulus, a bad cyclone season, mine disruptions or a delay at Simandou could hold the benchmark above US$100/t for longer than any of them implies. A softening benchmark also does not make low-cost producers uninvestable; it means their returns lean on volume, cost control and capital management rather than on a rising price. That distinction runs through the rest of this note.
3.00 — TWO MARKETS, ONE ORE
What "DR grade" actually means
The most common mistake in this theme is treating high-grade concentrate, pellet feed, DR pellets and HBI as interchangeable. They are separate products with separate customers, and the difference is where the risk and the margin sit. TABLE 02 sets out the ladder from mined product to furnace metal.

Chemistry is the entry ticket. Representative Midrex specifications put DR pellets (FIG. 03) at a minimum of about 67% Fe, with silica commonly 1.0% to 3.0%, alumina 0.2% to 3.0% and sulphur around 0.01% maximum, and the long-run aspiration for premium feed is more than 67% Fe with under roughly 2% combined gangue. These are operating ranges, not universal contract limits; individual plants can demand tighter numbers.
Chemistry alone, however, is not the product. A pellet must survive handling, reduction and discharge without breaking down, swelling or sticking together, and the reduced iron that comes out of the furnace may hold only about 25% to 35% of the parent pellet's strength. A concentrate with a spectacular headline grade can still fail as DR feed.
Hydrogen reduction does not remove these requirements either: Midrex trials of commercial pellets at around 67.6% to 68.3% Fe found hydrogen reduction faster than natural-gas reduction, with similar or slightly better product strength, but pellet structure remained decisive. Every new source still faces plant-specific qualification that can take years. FIG. 04 traces the full chain from orebody to electric furnace, and the four questions an investor should be able to answer at each step.


Magnetite deposits hold a natural advantage in this market. Grinding and magnetic separation can strip out most of the waste before the ore ever leaves the site, producing concentrates of 67% to 71% Fe with controllable chemistry.
Haematite direct-shipping ore cannot usually be engineered that way.
The price of that advantage is capital: concentrators, power, water, tailings storage and often a pellet plant. Fine grinding is energy hungry, and a high-grade product made with expensive or emissions-intensive electricity is not automatically a low-carbon product.
4.00 — THE DEMAND QUESTION
Real growth, uncertain timing
Global direct reduced iron production reached approximately 140.8 million tonnes (Mt) in 2024, a fourth consecutive record and roughly 30% above 2019 (FIG. 05). The direction is not in dispute. The timing and the scale are.

The market a new entrant actually has to sell into is far smaller and far more concentrated than the headline suggests. Of the pellets sold openly to DR plants in 2024, a pool of about 47.7 million tonnes, three suppliers accounted for almost three-quarters (FIG. 06).

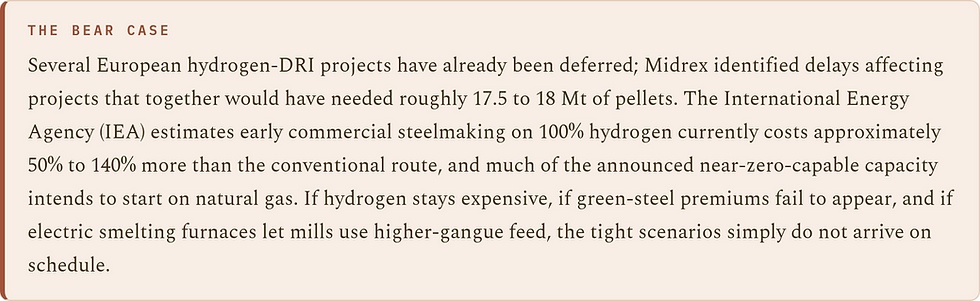
Midrex's December 2025 scenario work models merchant-ore DRI production more than doubling from about 32.9 Mt in 2024 to 72.4 Mt in 2034 (FIG. 07), but nearly every tonne of that growth comes from plants not yet built. On the pellet side, its 2034 scenarios range from a 5.6 Mt surplus to a 16.4 Mt deficit (FIG. 08) depending on which demand case and which supply case eventuate. Midrex is explicit that these are scenarios, not forecasts.


Other published scenarios run hotter. BloombergNEF work reported by the Institute for Energy Economics and Financial Analysis (IEEFA) implies a deficit of roughly 15 Mt by 2030 growing toward 133 Mt by 2040; S&P Global work reported by the same source points to a 70 to 85 Mt shortfall by 2035; and the International Iron Metallics Association has estimated merchant DR-pellet demand rising from about 47 Mt in 2022 to 58.5 Mt in 2026 and 117.3 Mt by 2033, with around 31.6 Mt of the 2033 figure not covered by identified supply. These studies use different definitions, some covering total DR-grade requirements and some only the merchant seaborne pool, and they should not be averaged into a consensus.
5.00 — THE PRICE OF PURITY
What the premium is, and what it is not
The cleanest public reference for DR-pellet pricing comes from Labrador Iron Ore Royalty Corporation, which reported the Platts DR pellet premium averaging approximately US$42 per tonne in the first quarter of 2026, down from US$45/t a year earlier. That premium is quoted over the 65% Fe high-grade fines index, which itself averaged about US$121/t in the quarter, not over the 62% benchmark. It softened year on year because steelmakers under margin pressure chose immediate cost savings over the efficiency benefits of premium feed.
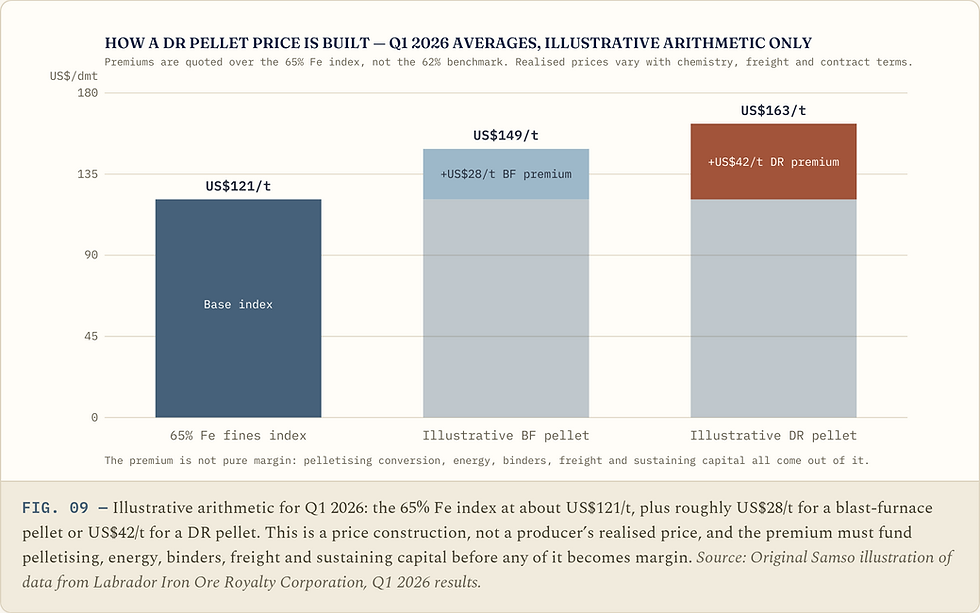
FIG. 09 shows the arithmetic, and it carries a warning: premium products remain cyclical. High-grade premiums widen when steel margins, environmental enforcement and productivity incentives are strong, and compress when mills are simply trying to survive a quarter. High grade is no hedge against a falling benchmark, because DR pricing is built on top of an index that moves with the same steel cycle.
The premium is not profit either. A pellet producer pays for conversion, fuel, binders, maintenance, freight and plant utilisation out of it (FIG. 10). Headline premium figures can also mislead. Vale reported a portfolio-wide "all-in premium" of just US$0.90/t in the fourth quarter of 2025, a number that covers its entire sales book of fines, blends and lower-premium products, and says almost nothing about what a qualified DR pellet earns under a long-term contract. The DR market is dominated by such contracts, with premiums often settled quarterly; spot indications can diverge from what established suppliers actually receive.

6.00 — THE VALE VARIABLE
Mega Hubs, briquettes, and a warning inside an opportunity
Vale is the most important company in this story, because it is not simply planning to sell more pellets. It is building a system: produce or source ore, concentrate it into high-grade feed, agglomerate it near cheap energy and deep ports, and partner with steelmakers who build the DRI and HBI plants next door (FIG. 11). Its proposed Mega Hubs in Oman, Saudi Arabia and the United Arab Emirates (UAE), with studies in Brazil, follow exactly that template.

The strategic point of Sohar is uncomfortable for anyone holding a remote deposit purely for its grade: Vale does not need every tonne of DR feed to start life as premium ore. It can ship a broader product to a hub and upgrade it next to the customer.
The second Vale variable is the cold-bonded briquette. Vale commissioned its first commercial briquette plant at Tubarão in December 2023 (FIG. 12), has a second plant scheduled before 2027, is testing a DR-specific briquette in cooperation with Midrex, and has studied a 1.5 Mtpa DR briquette plant in Louisiana. Vale claims its low-temperature process can involve lower cost, lower capital intensity and approximately 80% lower production emissions than conventional pelletising. If that qualifies at industrial scale across different shaft furnaces, the briquette becomes a genuine alternative to the indurated pellet, and a ceiling on how far DR-pellet premiums can stretch.


7.00 — THE ASX REGISTER
What this means on the Australian market
Australia is the world's dominant iron ore exporter, yet almost all of that dominance sits on the wrong side of the grade divide. The ASX exposure to the premium story is real but narrow, and it spans the full spectrum from operating cash flow to pure development option. Each company below gets the case for and the case against.
The incumbents: BHP, Rio Tinto and the haematite base
The major producers are the first horn of the dilemma in corporate form. Their Pilbara haematite operations are among the lowest-cost mines on earth, and at US$100/t they generate extraordinary cash. On the REQ deck, that cash compresses steadily through 2031, and their returns become a function of volume, cost and capital discipline rather than price. Rio Tinto also holds an important, often overlooked position on the other side of the divide: through the Iron Ore Company of Canada (IOC) it is already one of only three suppliers of DR pellets to the seaborne merchant market, alongside Vale and Samarco. The incumbents are not absent from the premium story. They are simply not priced on it.
Fortescue (ASX: FMG): the cautionary success
Iron Bridge is Australia's flagship magnetite project (FIG. 13) and the most instructive single data point in this note. It produces a genuine 67% to 68% Fe concentrate, exactly the product the DR transition wants. It also cost approximately US$3.9 billion, arrived a year late, and its ramp-up has been repeatedly extended: after plant reliability problems, Fortescue guided shipments of 10 to 12 million tonnes for the 2026 financial year against a 22 Mtpa nameplate, with full capacity now expected in financial year 2028, a five-year ramp from first production in 2023. Even a company with a fortress balance sheet, existing port and rail, and world-class operating teams found magnetite harder, slower and more expensive than planned. And yet the product is real, it ships, and it gives Fortescue a premium stream its haematite peers lack. Both halves of that sentence are the dilemma.

Grange Resources (ASX: GRR): the quiet incumbent
Grange is the company the magnetite hopefuls want to become, and the market barely prices it. Savage River in Tasmania has mined magnetite since 1967, and the Port Latta plant produces more than two million tonnes of low-impurity blast-furnace pellets a year, realising prices at a substantial premium to the fines benchmarks; its reported average realised price in the March 2026 quarter was approximately US$126/t. The case against is equally concrete: its pellets are BF-grade rather than DR-grade, its customer base is narrow, Tasmanian costs are rising, and the transition of the North Pit to underground mining is a genuine execution risk even after a positive feasibility study. Grange also holds Southdown near Albany, a large undeveloped magnetite project that is effectively a free option on this entire theme at the company's current valuation, and an option is all it is until somebody funds it.
Champion Iron (ASX: CIA): the proof that Tier 1 exists
Champion is listed on the ASX but operates in Canada's Labrador Trough (FIG. 14), and it has just done the thing every developer promises. In late June 2026 it announced first production of DR-quality iron ore from its Bloom Lake direct-reduction pellet feed (DRPF) project, completed within its estimated $500 million budget, upgrading half the operation toward a product of up to 69% Fe with combined silica and alumina below 1.2%. Commissioning is still under way: an inaugural Capesize sale of at least 160,000 wet tonnes is expected in the third quarter of 2026, a commercial agreement already covers part of near-term capacity, and commercial production is expected toward the end of the company's financial year, around March 2027. This is what the strongest risk-adjusted version of the DR theme looks like: an existing producer spending incremental capital to upgrade a product it already sells, with real costs, real logistics and real customers. What remains is the ramp and the order book: reaching commercial production on schedule, the premium the market actually pays through a soft steel cycle, and how quickly the rest of the volume finds binding offtake.

Iron Bear Resources (ASX: IBR): the giant with a giant bill
Iron Bear near Schefferville, also in the Labrador Trough (FIG. 15), is the most ambitious DR story on the ASX. Its owner renamed itself from Cyclone Metals to Iron Bear Resources in January 2026, changing its ticker from CLE to IBR, so the company now carries the name of its defining asset. The numbers: a mineral resource of 13.6 billion tonnes at about 30% Fe under the company's June 2026 update, and a 2025 scoping study outlining a 25 Mtpa operation producing about 16 Mt of roughly 70% Fe blast-furnace concentrate and 9 Mt of 71% Fe DR pellets with around 1.1% silica, pre-production capital of approximately US$4.6 billion and a post-tax net present value (NPV) of around US$9.8 billion. Vale's involvement, a staged agreement under which Vale can invest up to about US$138 million to earn up to 75% of the project, with a decision to mine targeted around 2028, is exactly the kind of strategic validation Section 8 says to look for. The other side of the ledger: the capital requirement is many multiples of the company's market value, the Vale agreement is staged rather than guaranteed, a pre-feasibility study is still in progress, and the history of this sector says the distance between a spectacular study and a financed construction decision is where most shareholder value goes to die, or gets diluted to death. Iron Bear can be a company-maker and a value trap from the same spreadsheet, depending entirely on the funding path.

The Champion yardstick: what Iron Bear's discount is really pricing
The obvious question follows: if Champion can support a market capitalisation of roughly A$2.4 billion on the back of Labrador Trough iron ore, and Iron Bear Resources trades at roughly A$83 million, is Iron Bear a cheap entry into the same business? The comparison is genuinely worth making, because the similarities are real. The two projects sit about 200 km apart on the same iron formation, would ship through the same rail-and-port corridor to Sept-Îles, target the same DR-quality end market, and both hold major-company validation: Champion through a commercial agreement with a global steel group, Iron Bear through its staged agreement with Vale. On product, Iron Bear's pilot work at 71% Fe with about 1.1% silica sits alongside, and on paper slightly above, the 69% Fe product Champion has just produced. On scale, the 25 Mtpa scoping concept would out-produce Bloom Lake's 15 Mtpa nameplate. Judged purely as orebodies feeding the same future market, a valuation gap of roughly thirty times looks extreme.
The gap, however, is pricing real differences, and an investor should be able to name them. Champion's value sits on cash flow that exists: about 15 Mtpa of production, roughly $1.8 billion in annual revenue, and a DR upgrade paid for out of earnings. Iron Bear's value sits on a study. Ownership differs too. Champion owns 100% of Bloom Lake, having bought out the Québec government's 36.8% for C$211 million; if Vale funds Iron Bear through its full earn-in, Iron Bear Resources shareholders could hold as little as 25% of the project. The honest comparison is therefore not company against company. It is a minority share of an unbuilt US$4.6 billion project against full ownership of an operating one.
The history behind Champion's valuation is the part the cheap-entry argument most needs to confront. Champion never built Bloom Lake from a small-cap base. Consolidated Thompson built it; Cliffs Natural Resources paid about C$4.9 billion for it near the top of the 2011 market, shut it within four years, and Champion bought the constructed mine and its rail assets out of creditor protection in 2016 for C$10.5 million cash plus about C$43 million in assumed liabilities. Champion's billions were created by buying distressed, already-sunk capital for a fraction of a cent in the dollar and restarting it well. Iron Bear has to do the harder thing: fund a first build. The Australian precedents for greenfield magnetite at that scale are Sino Iron, Karara and Iron Bridge, and in each case the asset eventually worked while early equity carried heavy losses or dilution. TABLE 03 sets the two companies side by side.

What could a 25% share be worth? Two pieces of illustrative arithmetic frame the question, and both need their assumptions read as carefully as their answers. The first takes the scoping study at face value: 25% of the US$9.79 billion post-tax net present value is about US$2.4 billion, or roughly A$3.7 billion at an assumed exchange rate of about US$0.66. The second anchors to what the market pays today for producing Labrador Trough tonnes: Champion's approximately A$2.4 billion capitalisation over its 15 Mtpa of capacity implies about A$160 million per producing million tonnes of annual capacity, and Iron Bear's attributable 6.25 Mtpa (25% of the 25 Mtpa concept) on that yardstick is worth about A$1.0 billion. TABLE 04 sets both results against today's market capitalisation.

Against a current capitalisation of about A$83 million, either end-state figure is more than ten times today's price, and that is exactly why the assumptions deserve the emphasis. These are values for a delivered project in the 2030s, not fair prices for today. A scoping study carries an accuracy range of tens of per cent in either direction. Pre-production companies almost never trade at the face value of their study NPV; a fraction of it is normal. And the largest unknown is funding: if Iron Bear Resources must fund its 25% share of the roughly US$4.6 billion build, that is in the order of US$1.15 billion against an A$83 million equity base, and the terms on which that money is raised, or the extent to which the Vale agreements carry Iron Bear through construction, will determine how much of any end value today's shareholders actually keep. Readers should verify the carry and funding terms in the definitive agreements before leaning on either number. This is illustrative arithmetic, not a valuation, a forecast or a price target.
Read this way, the Champion comparison supports one specific conclusion and no more: the market demonstrably pays billions for qualified, producing Labrador Trough DR-grade iron ore, so the destination Iron Bear is pointed at has proven value. What the comparison cannot do is shortcut the path. Iron Bear today is a low-priced option on that destination, and options of this kind re-rate on milestones rather than on production: the pre-feasibility study due through 2026, each stage of Vale's funding elections, and the decision to mine targeted around 2028. Each Vale dollar validates the project, and each stage also transfers more of it to Vale.

Magnetite Mines (ASX: MGT) and Hawsons Iron (ASX: HIO): the Braemar options
South Australia's Braemar iron formation hosts two listed development options. Razorback, 240 km northeast of Adelaide (FIG. 16), targets a DR-grade concentrate of about 68.5% Fe from a 3.8 billion tonne resource, sits near open-access rail and a renewables-heavy grid, and in February 2026 became the only iron ore project on the Federal Government's Major Project Status list, a designation that helps with approvals but funds nothing.

Hawsons, 70 km from Broken Hill (FIG. 17), targets an ultra-premium concentrate around 69% to 70% Fe using a dry-processing flowsheet, and has a completed pre-feasibility study. Hawsons Iron is also the cautionary tale of this pair. In late 2022 the company paused its own bankable feasibility study, the final study before a build decision, because cost inflation had pushed the projected capital and operating numbers beyond what the project could support.
It later re-scoped the project around a smaller, staged development. The episode shows exactly where the fragility in development-stage magnetite sits. The orebody did not change and the product target did not change, but the cost environment moved and the project had to stop.
Both hold genuinely DR-capable geology. Both need capital measured against their market values in multiples, plus infrastructure, water solutions, offtake and years of qualification. They are long-duration options on the second market, and options can expire.

The history the sector would rather forget
Balance requires the record. CITIC's Sino Iron project in the Pilbara was conceived at a capital cost of roughly US$2.5 billion and ended up costing in the order of US$10 to 12 billion, years late. Karara in Western Australia's Mid West consumed well over A$2.5 billion, and Gindalbie Metals shareholders were substantially wiped out before Ansteel consolidated the asset. Both projects, note carefully, now operate and ship premium concentrate. The orebodies were real and the product was good. The equity path was catastrophic anyway. That is the sharpest possible statement of the dilemma: in magnetite, the asset can win while the shareholder loses. TABLE 05 summarises the seven exposures and the case for and against each.


8.00 — HOW TO READ A MAGNETITE STORY
The framework before the valuation
Before assigning any DR-grade value to a project, an investor should be able to tick through six layers of evidence, in roughly this order of difficulty.
Complete chemistry, not just iron. A company reporting "70% Fe concentrate" has started the work, not finished it. Silica, alumina, phosphorus, sulphur, alkalis and titanium determine whether the product qualifies, and the grade must be achievable at a commercial recovery, grind size and energy cost across the whole deposit, not from a hand-picked composite.
Pelletising and reduction testwork. Green-ball formation, fired strength, abrasion, reducibility, swelling, clustering and post-reduction strength, under both natural-gas and hydrogen-rich conditions. Bench-scale chemistry alone does not make DR pellet feed.
Delivered cost, not mine-gate cost. A cheap concentrate at the plant can be uncompetitive after grinding power, pelletising, rail, port, shipping and royalties. Compare the cost landed at the customer, and note that the largest variables, grid power price, water, rail distance, port capacity, usually sit outside the mine gate entirely.
Conservative pricing. A robust study works at a conservative 65% index, a conservative grade spread and a conservative DR premium. A project that needs both a permanently high iron ore price and a historically elevated premium is a bet on two cycles at once.
Capital intensity per annual tonne. Champion's roughly $500 million to upgrade about 7.5 Mtpa of existing capacity and a greenfield project's US$4 billion-plus to build 10 to 25 Mtpa are not the same investment proposition, whatever the resource sizes say. Large resources can hide poor capital efficiency.
Funding and dilution. For a small company, the deposit can succeed while the shareholder fails. How much must be raised before a construction decision? Will existing holders retain meaningful ownership?

FIG. 18 condenses all of this into the Samso screening frame: product qualification on one axis, execution readiness on the other. TABLE 06 pairs each archetype with what an investor has to believe and what breaks the thesis.

9.00 — THE WHAT-IFS
Samso concluding thoughts: a dilemma is not resolved by a tip - the concluding iron ore story investment case.
Samso's usual habit is to end with a view. This Insight ends differently, on purpose. The iron ore dilemma does not have a single correct answer, because the answer depends on variables nobody controls and on each reader's own horizon, risk tolerance and need for income against growth. What we can do is lay the plausible futures side by side, with who benefits and who is exposed in each, and let the reader decide which future they are actually prepared to underwrite.


The four futures share one thing. In every one of them, an operating asset with a qualified product and a funded balance sheet lands somewhere between fine and excellent, while an unfunded promise lands somewhere between stranded and diluted. The futures disagree violently about which product earns the premium. They agree almost completely about who survives to collect it.

10.00 — REFERENCES & SOURCES
References & sources
Every figure and claim in this Insight is sourced below. The figures fall into two categories. FIG. 03, 10, 12, 13 and 14 are photographs, and FIG. 15, 16 and 17 are company maps, reproduced from publicly released company materials with the source credited in each caption. All remaining charts and diagrams (FIG. 01, 02, 04 to 09, 11 and 18) are original Samso illustrations of data and concepts from these references. The locator map (FIG. 01) is an original Samso illustration drawn on a public-domain Natural Earth basemap, with deposit positions plotted at approximate true coordinates from company disclosures. Company figures are as at the publication dates shown in their captions. Market-sensitive numbers (spot prices, index averages and premiums) were current at the time of writing in mid-July 2026 and are to be refreshed on publication day.
Midrex Technologies, Inc. 2024 World Direct Reduction Statistics (global DRI production of 140.8 Mt in 2024; regional and merchant supply data, including the 47.7 Mt merchant DR-pellet supply pool and producer shares).
Midrex Technologies, Inc. "Iron Ore for Direct Reduction: The Challenge Updated", Direct From Midrex, December 2025 (2034 merchant pellet demand scenarios of 104.9 Mt and 110.7 Mt; supply scenarios of 94.3 Mt and 110.5 Mt; merchant-ore DRI base case to 2034; European project delays affecting roughly 17.5 to 18 Mt of pellet demand; DR-grade chemistry guidance; hydrogen reduction trial results).
Labrador Iron Ore Royalty Corporation. First quarter 2026 results (Platts DR pellet premium averaging approximately US$42/t in Q1 2026 versus US$45/t in Q1 2025, quoted over the 65% Fe index; 65% Fe index average of approximately US$121/t; commentary on steelmakers prioritising cost savings over premium feed).
Vale S.A. Public disclosures and releases (Tubarão briquette plant inauguration, December 2023; second plant and mobile unit; Midrex technical cooperation on DR briquettes; Louisiana 1.5 Mtpa DR briquette plant study; Mega Hub descriptions in Oman, Saudi Arabia and the UAE; Q4 2025 portfolio all-in premium of US$0.90/t; claimed briquette cost and emissions advantages).
Vale S.A. and Jinnan Iron & Steel. Sohar concentration project disclosures (approximately 18 Mtpa feed producing approximately 12.6 Mtpa of high-grade concentrate; targeted start around mid-2027; Vale infrastructure commitment of approximately US$227 million; Jinnan investment reported at approximately US$400 million).
Australian Government, Department of Industry, Science and Resources. Resources and Energy Quarterly, June 2026 (iron ore export earnings of A$117 billion in 2025-26 declining to A$77 billion in real 2025-26 dollars by 2030-31; 61% Fe FOB price deck of US$91/t in 2026 to US$72/t nominal in 2031; Chinese import projections; Indian steel demand growth of roughly 5.4% annually; Australian average cash costs of about US$33/t in 2025).
World Bank. Commodity Markets Outlook (iron ore averaging US$97/t in 2026 and US$95/t in 2027).
Fitch Ratings. Metals and mining price assumptions, June 2026 (62% Fe CFR China at about US$100/t for 2026 and US$90/t for 2027).
International Energy Agency (hydrogen-based steelmaking cost premium of approximately 50% to 140% over conventional BF-BOF, and natural-gas start-up for most announced near-zero-capable capacity).
IEEFA reporting of BloombergNEF and S&P Global DR-grade supply-demand scenarios; International Iron Metallics Association merchant DR-pellet demand estimates (approximately 47 Mt in 2022, 58.5 Mt in 2026 and 117.3 Mt by 2033, the latter with around 31.6 Mt not covered by identified supply, as cited in Fastmarkets pricing notices, April 2026).
Champion Iron Limited (ASX/TSX: CIA). ASX/TSX release, 28-29 June 2026 (first production of DR-quality iron ore from the Bloom Lake DRPF Project; completion within the estimated $500 million budget; product of up to 69% Fe with combined silica and alumina below 1.2%; inaugural Capesize sale of at least 160,000 wmt (wet metric tonnes) anticipated in calendar Q3 2026; commercial agreement covering part of near-term capacity; commissioning ongoing, with commercial production expected toward the end of the company's financial year), and quarterly activities reporting.
Fortescue Ltd (ASX: FMG). Iron Bridge disclosures and market reporting (first production April-May 2023 at greater than 67% Fe; 22 Mtpa nameplate; joint venture 69% FMG Magnetite and 31% Formosa Steel IB; May 2025 revised ramp-up guiding FY2026 shipments of 10 to 12 Mt and nameplate in FY2028; total capital of approximately US$3.9 billion).
Grange Resources Limited (ASX: GRR). Quarterly reports and announcements (Port Latta pellet production of more than 2 Mtpa; average realised price of approximately US$126/t in the March 2026 quarter; North Pit Underground Definitive Feasibility Study, February 2025; Southdown Magnetite Project).
Iron Bear Resources Ltd (ASX: IBR), formerly Cyclone Metals Limited (ASX: CLE); the company changed its name and ticker in January 2026. Iron Bear scoping study, August 2025, and Vale agreement disclosures, February 2025 (mineral resource of 13.6 billion tonnes at 30.03% Fe, including 4.5 Bt indicated at 29% Fe, per the company's June 2026 project update, earlier reported at 16.7 Bt; 25 Mtpa concept producing about 16 Mt of roughly 70% Fe BF concentrate and 9 Mt of 71% Fe DR pellets at about 1.1% silica; pre-production capital of approximately US$4.6 billion; post-tax NPV8 (net present value at an 8% discount rate) of approximately US$9.8 billion; staged Vale funding of up to approximately US$138 million to earn up to 75% of the project; decision to mine targeted around 2028).
Magnetite Mines Limited (ASX: MGT). Company disclosures (Razorback DR-grade concentrate target of approximately 68.5% Fe; 3.8 Bt project resource; proximity to rail, grid and Spencer Gulf ports; Federal Major Project Status effective 11 February 2026).
Hawsons Iron Limited (ASX: HIO). Company disclosures (target concentrate of approximately 69% to 70% Fe; completed pre-feasibility study; bankable feasibility study paused in late 2022 amid cost escalation and subsequently re-scoped).
Bloom Lake ownership history, public record (Cliffs Natural Resources' acquisition of Consolidated Thompson Iron Mines for approximately C$4.9 billion including net debt, announced January 2011; Bloom Lake suspension and creditor protection, 2015; acquisition of the Bloom Lake mine and rail assets by Champion Iron's subsidiary Quebec Iron Ore for C$10.5 million cash plus approximately C$42.8 million in assumed liabilities, completed April 2016; acquisition of the remaining 36.8% minority interest in Bloom Lake for C$211 million, completed around the turn of 2026).
Market capitalisations, exchange data, mid-July 2026, approximate and to be refreshed on publication day (Champion Iron approximately A$2.4 billion; Iron Bear Resources approximately A$83 million at about A$0.073 per share). The illustrative valuation arithmetic in Section 7 combines these figures with the Iron Bear scoping study outputs and an assumed AUD/USD exchange rate of approximately 0.66; all inputs are approximate and to be refreshed on publication day.
Historical capital outcomes, public record (CITIC Sino Iron: initial estimate of roughly US$2.5 billion against a final cost reported in the order of US$10 to 12 billion; Karara: capital in excess of approximately A$2.5 billion and the effective loss of Gindalbie Metals shareholder value prior to Ansteel consolidation). Figures approximate; readers should consult primary filings.
Spot pricing, mid-July 2026 (62% Fe CFR China trading at approximately US$100 to US$105/t across published indices, including a KORE 62% Fe Qingdao print of US$102.73/t on 14 July 2026, after a late-June dip below US$100/t).
Reproduced company imagery: iron ore pellet and Port Latta plant photographs (FIG. 03 and 10) from Grange Resources Limited's corporate website, grangeresources.com.au, tonal levels adjusted for print; Vale briquette plant photograph (FIG. 12) by Rafael Coelho / Vale, from Vale's public news releases on the Tubarão briquette plants, December 2023; Iron Bridge photograph (FIG. 13) from Fortescue's public news release "Fortescue's Iron Bridge commences high grade magnetite production", April 2023; Bloom Lake photograph (FIG. 14) from Champion Iron Limited's corporate website, championiron.com; Iron Bear location map (FIG. 15) from the scoping study materials of Iron Bear Resources Ltd, published under its former name Cyclone Metals, as republished by Stockhead, 12 August 2025; Razorback project map (FIG. 16) from Magnetite Mines Limited's website (project map, October 2025); Hawsons location map (FIG. 17) from Hawsons Iron Limited's website, hawsons.com.au. All reproduced with attribution; rights remain with the respective companies and photographers.
Natural Earth. Free vector map data, public domain (coastlines used in FIG. 01).
The Samso Way – Seek the Research
Here at Samso, we pride ourselves on delivering content for investors that is independent and informed by over three decades of experience in the industry. Our content is well-researched and is only created if I see merit in discussing the company's story.
Our mission is simple: cut through the noise and spotlight what matters—genuine stories, grounded insights, and real opportunity.
Our content is well-researched and is only created if the team sees merit in discussing the company or concept. Investors can explore our three core platforms:
There may be numerous paths to success in investing, but the common thread among successful individuals is that they remain committed to making informed decisions. Equip yourself with the right knowledge and tools, and you will be well on your way to achieving your financial goals.
Most importantly, investors need to be absolutely diligent in understanding their own risk-reward tolerance and capabilities. Never bite off more than you can chew. As they say, Rome wasn’t built in a day, and the Great Wall stood because it took centuries to complete.
The Samso Philosophy:
Stay curious. Stay sharp. And remember—digging deeper always uncovers the real value.
In Life, there is no such thing as a Free Lunch.
Never bite off more than you can chew is my parting comment.
Happy Investing, and the only four-letter word you need to know is DYOR.
To support our independent work, please head over to our Support Page and give us a helping hand in any of the ways listed. This is a new initiative for the Samso Platform, and it was always the concept of Samso when we started this journey in 2018.
Disclaimer
The information or opinions provided herein do not constitute investment advice, an offer, or solicitation to subscribe for, purchase, or sell the investment product(s) mentioned herein. It does not take into consideration, nor have any regard to your specific investment objectives, financial situation, risk profile, tax position and particular, or unique needs and constraints.
Samso is a trusted platform that equips dedicated investors with up-to-date industry knowledge and insights from top CEOs and thought leaders. By staying informed on business advancements and market trends, investors can enhance their financial decisions through a combination of expert guidance and their own research.
Samso Insights | www.samso.com.au | An Investor Lens on ASX-Listed Companies


Comments