


Power Minerals (ASX: PNN) - Whether the Chart Supports the Uptrend

Power Minerals has risen through most of 2026 and a two-year chart looks like an uptrend. Samso measures the trend, the momentum and the turnover behind it, and explains each measure in plain English as it arrives.


Alistair Stephens has been presenting Power Minerals and the opportunities the company is looking at across its portfolio. That presentation is why Samso opened the chart. It is not what this piece is about.
Most people who open a two-year chart of Power Minerals will say the same thing. It looks like it is going up. That sentence is what this article tests. Everything below is a measurement of the share price line and nothing below is a view on the company's projects, its accounts or its plans.
All prices are Yahoo Finance daily data for PNN.AX covering 19 September 2024 to 18 September 2026, which is 507 trading sessions.
1.00 THE TWO-YEAR RANGE. Where the Price Is Today for Power Minerals
Over those two years the lowest price Power Minerals reached was A$0.055, on 27 June 2025. The highest was A$0.305, on 16 October 2025. The last close of A$0.15 is 50.8 per cent below that high and 173 per cent above that low.
Both of those are true at the same time. A single percentage says almost nothing until the date it was measured from is known, and that is why technical traders use measures that do not depend on a chosen starting point. FIGURE 01 plots the whole period, with turnover underneath the price.


2.00 MOVING AVERAGES. The Long Trend, Measured
A moving average is the average closing price over a set number of trading days, recalculated each day. A 200-day moving average is the average of the last 200 closes. Traders use it because it strips out the daily noise and leaves the direction.
At 18 September 2026 the 200-day average for Power Minerals was A$0.1232. The last close of A$0.15 is 21.8 per cent above it. The average itself has risen 5.85 per cent over the previous 20 sessions, so the line is pointing upwards rather than flattening. The 50-day average, which covers about ten trading weeks, was A$0.1462, and the close is 2.6 per cent above that one as well. Both lines are drawn in FIGURE 02.

The 200-day line is the measure most often quoted when a professional describes a stock as being in a long uptrend. Paul Tudor Jones has said in published interviews that he uses it as a risk filter and stays out of things trading below it. On this measure, the reader who said the chart is going up is correct.
3.00 ADX. Whether the Trend Is Strong Enough to Be Called One
A price can be above a rising average and still be drifting rather than trending. The Average Directional Index, or ADX, was introduced by J. Welles Wilder in New Concepts in Technical Trading Systems in 1978 to separate the two. It measures how strongly a price is moving in one direction. It does not say which direction.
Power Minerals reads 29.5. The convention in the market, which is later convention rather than Wilder's own, is that a reading above 25 describes a market that is trending and one below 20 describes a market that is not. That is a convention rather than a proven result, and it is fair to say so.
Wilder paired ADX with two companion lines. The positive directional indicator, +DI, measures upward movement, and the negative directional indicator, -DI, measures downward movement. Power Minerals reads +DI 25.6 against -DI 19.8, so the movement is on the upside. All three lines are in FIGURE 03.
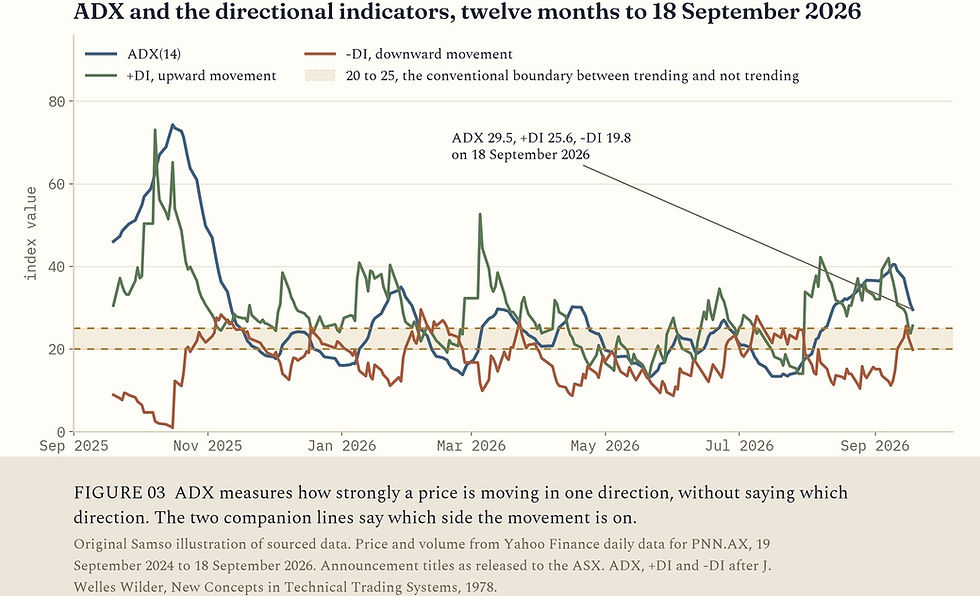
The long trend is real and it is up. That is as far as the long measures go.
4.00 THE SHORT HORIZON. Three Measures That Have Turned Down
Three measures answer a shorter question, and all three now read the other way.
The 10-day exponential moving average is an average of the last ten closes that gives more weight to the most recent days. Marty Schwartz described it in Pit Bull in 1999 as the measure he used to tell which side of a trade to be on. It was A$0.1553 on 18 September, and the close of A$0.15 is 3.4 per cent below it.
MACD, the moving average convergence divergence, is widely credited to Gerald Appel, an American money manager and newsletter writer, who set it out in his own booklet, The Moving Average Convergence-Divergence Trading Method, in the late 1970s. It takes the difference between a 12-day and a 26-day exponential average and compares that difference against its own 9-day average, called the signal line. When the first falls below the second, recent prices have weakened against the longer ones. On Power Minerals the MACD line was -0.00034 against a signal line of 0.00307, and it crossed below on 9 September, seven sessions before the last close. The fair caveat is that MACD is built from moving averages and will produce crossings that lead nowhere when a price is moving sideways.
The Relative Strength Index, also Wilder's, in the same 1978 book, compares the size of recent gains against recent falls on a scale of 0 to 100. Power Minerals reads 46.2. It read 67.8 on 7 September and 84.8 on 15 October 2025. Wilder proposed 70 and 30 as the levels at which a price could be called overbought or oversold. On a small explorer in a re-rating those levels do not transfer, because a stock on a run can hold above 70 for weeks. FIGURE 04 carries both measures.

Over the last 20 sessions the price has fallen 11.8 per cent. Since the close of A$0.185 on 7 September it has fallen 18.9 per cent in nine sessions.
So the chart carries two readings at once. Measured over months it is going up. Measured over the last fortnight it is going down. Neither cancels the other, and a reader looking at a chart should always know which window a claim was made in.

5.00 16 OCTOBER 2025. The Heaviest Session of the Two Years
The heaviest session in the two years was 16 October 2025.
Power Minerals closed at A$0.225 on 15 October. The next morning it opened at A$0.285, which is 26.7 per cent higher. It traded as high as A$0.305, the highest price of the two years. It then closed at A$0.215, which is 24.6 per cent below its own opening price and 4.4 per cent below the previous close. FIGURE 05 draws that session with the eight sessions either side of it.
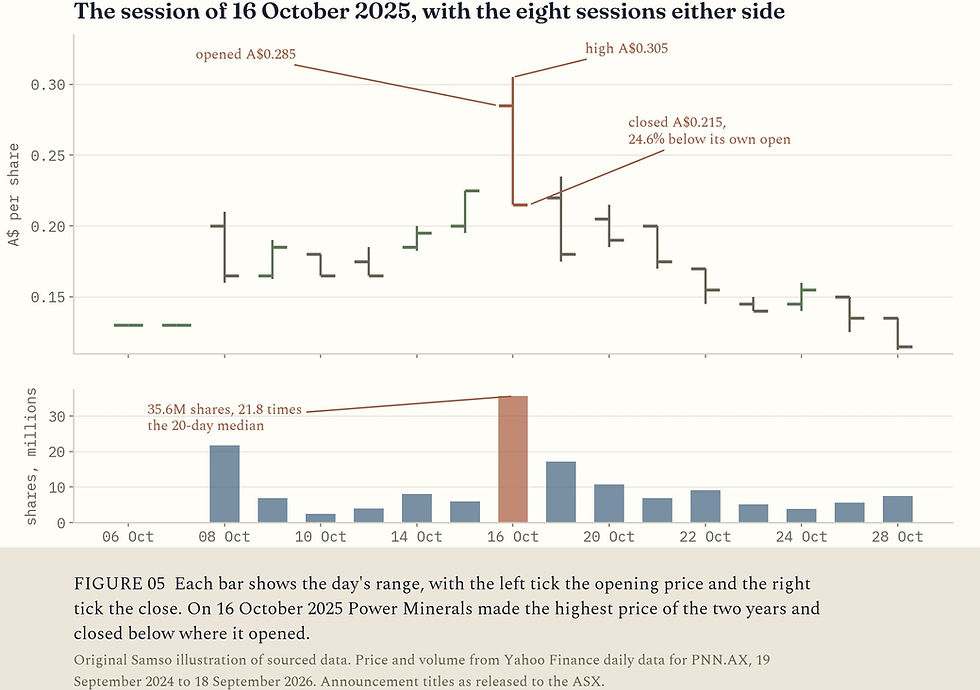
Turnover was 35,638,918 shares. Two of the preceding 20 sessions were halted and traded nothing, and across the 18 that did trade the middle one traded 1,635,993 shares. That makes 16 October 21.8 times the recent normal. It remains the largest single session by share count in the two years.
A session that opens far above the previous close, makes the highest price of the period, and then closes below where it opened is what technical traders describe as a reversal. The buying came in at the open and the sellers had the rest of the day.
The ASX headline that morning read "PNN BRIEFING AUS AMBASSADOR AHEAD MEETING WITH US PRESIDENT". The ASX caps a headline at 60 characters, and the document itself is titled "PNN Invited to Brief Australian Ambassador Ahead of Prime Minister's Meeting With President Trump".
From that A$0.305 high the price fell to A$0.078 on 18 December 2025, a fall of 74.4 per cent in two months.
The volume figure on its own said nothing about direction. The distance between the open and the close said all of it.
6.00 VOLUME AGAINST ITS OWN MEDIAN. What the Turnover Has Done Since July
Volume is easier to read against its own recent history than as a raw number. The usual method is to take the median of the last 20 sessions, which is the middle value once they are sorted, and express the day being looked at as a multiple of it. The median is used rather than the average because one enormous day would drag an average upwards and make every other day look quiet.
A large multiple is rare. Across the 507 sessions in the two years, 13 of them traded at ten times their own preceding 20-day median or more. That is about one session in 39.
Power Minerals has been reporting rare earth drilling results from its Morro do Ferro project through this period. The turnover each one has drawn is set out in TABLE 01 and drawn in FIGURE 06.


The company has continued drilling and continued reporting, and the turnover each announcement attracts has fallen at every step. That is a measurement of how the market has responded, and it is not a comment on the results themselves.
7.00 CHART TRAPS. Three Things in the Line That Are Not Price
Some of what a chart draws is not a market at all, and these are the traps a reader should know about before trusting any pattern.
Flat sessions with no turnover. In the two years, 32 sessions show no shares traded and a flat price. Three of them are recent, on 21 August, 2 September and 3 September 2026, when the shares were in a trading halt. A chart draws a halt as a flat line, which looks like a quiet market rather than a closed one. Two of them are visible at the left of FIGURE 05, on 6 and 7 October 2025.
New shares issued during the window. Power Minerals lodged a cleansing notice on eleven separate dates between 1 May 2025 and 26 June 2026. A cleansing notice is what a company files when it issues new shares, and each one adds shares to the register. A moving average calculated across such a date is arithmetically correct and is comparing two slightly different companies.
How thin the market is. Two of the last 20 sessions were halted, and across the 18 that did trade the middle one turned over about A$400,000 worth of stock. A pattern drawn by that much turnover is the work of a small number of participants.

8.00 THE FAILURE CONDITION. What Would Change This Reading
Four things, all of them visible on the chart.
1. A close below the 200-day average, A$0.1232 at 18 September, held for more than a few sessions and on turnover above the recent median.
2. The 200-day line turning down. It is rising 5.85 per cent over 20 sessions now.
3. The next company announcement drawing turnover below its own 20-day median, which would continue the pattern in TABLE 01.
4. MACD crossing back above its signal line while the price is also above the 10-day average, which would say the short horizon has turned back up.
THE OTHER WAY TO READ THIS The fall since 7 September may be an ordinary pullback inside an uptrend rather than the start of anything. The price is still above both the 50-day and the 200-day averages. The average daily range on Power Minerals, measured as the 20-day Average True Range on Wilder's smoothing, is 6.95 per cent of the price, and the two halted sessions in that window pull that figure down a little, so a move of 18.9 per cent covers only a few normal sessions. The MACD crossing is the kind of signal that measure produces when a price moves sideways, which its own literature warns about. On that reading nothing has happened except that the price came back towards its own averages. |
9.00 THE SAMSO VIEW. Samso Concluding Comments
The reader who looked at this chart and said it is going up was reading the long measures, and the long measures agree with them. The price is above a rising 200-day average and above the 50-day average, and ADX at 29.5 with +DI above -DI describes a real trend rather than a drift.
The short measures do not agree, and they are measuring the same chart. The price is below its 10-day average, MACD crossed down on 9 September, RSI has come back from 67.8 to 46.2, and the price has given up 18.9 per cent since 7 September.
The turnover figures are the part of this chart Samso finds most useful. A share price that keeps rising while each piece of news draws less trading than the one before is describing a market that is becoming harder to interest. That is a measurable thing and a reader can check it themselves on any stock, by taking the 20-day median volume and dividing each announcement day by it.
SAMSO TAKE The two horizons on this chart disagree, and both of them are measurements rather than opinions. The long measures describe an uptrend that is still in place. The short measures describe a pullback inside it that started on 7 September. The turnover is where Samso would look next. Five drilling results landed between 31 July and 7 September, and each one drew less trading than the one before it. What would the next announcement have to do to break that pattern? |
VOCABULARY, IN PLAIN ENGLISH Moving average. The average closing price over a set number of trading days, recalculated each day. Exponential moving average. A moving average that gives more weight to the most recent days. ADX, Average Directional Index. A measure of how strongly a price is moving in one direction. Introduced by J. Welles Wilder in New Concepts in Technical Trading Systems in 1978, the book that also gave the market RSI and the Average True Range. +DI and -DI. Wilder's companion lines, measuring upward and downward movement. RSI, Relative Strength Index. Compares the size of recent gains against recent falls, on a scale of 0 to 100. Also Wilder, 1978. MACD. The gap between a 12-day and a 26-day exponential average, compared against its own 9-day average. Credited to Gerald Appel, an American money manager and newsletter writer, who set it out in his own booklet, The Moving Average Convergence-Divergence Trading Method, in the late 1970s. ATR, Average True Range. The average size of a daily price range, used to describe how wide the normal day is. Median volume. The middle value of a set of daily volumes once sorted, used instead of an average so one very large day does not distort it. Trading halt. A pause in trading requested by a company. The chart draws it as a flat line with no turnover. Cleansing notice. A notice lodged with the ASX when new shares are issued, allowing them to be traded. |
 The Samso Way – Seek the ResearchHere at Samso, we pride ourselves on delivering content for investors that is independent and informed by over three decades of experience in the industry. Our content is well-researched and is only created if I see merit in discussing the company's story. Our mission is simple. Cut through the noise and spotlight what matters. Genuine stories, grounded insights, and real opportunity. Investors can explore our four core platforms:
There may be numerous paths to success in investing, but the common thread among successful individuals is that they remain committed to making informed decisions. Equip yourself with the right knowledge and tools, and you will be well on your way to achieving your financial goals. Most importantly, investors need to be absolutely diligent in understanding their own risk-reward tolerance and capabilities. Never bite off more than you can chew. As they say, Rome wasn't built in a day, and the Great Wall stood because it took centuries to complete. The Samso Philosophy: Stay curious. Stay sharp. And remember, digging deeper always uncovers the real value. In Life, there is no such thing as a Free Lunch. Never bite off more than you can chew is my parting comment. Happy Investing, and the only four-letter word you need to know is DYOR. To support our independent work, please head over to our Support Page and give us a helping hand in any of the ways listed. This is a new initiative for the Samso Platform, and it was always the concept of Samso when we started this journey in 2018. DisclaimerThe information or opinions provided herein do not constitute investment advice, an offer, or solicitation to subscribe for, purchase, or sell the investment product(s) mentioned herein. It does not take into consideration, nor have any regard to your specific investment objectives, financial situation, risk profile, tax position and particular, or unique needs and constraints. About SamsoSamso is a trusted platform that equips dedicated investors with up-to-date industry knowledge and insights from top CEOs and thought leaders. By staying informed on business advancements and market trends, investors can enhance their financial decisions through a combination of expert guidance and their own research. Coffee with Samso, Samso Insights, Samso News and Samso Research are four ways into the same work. Interviews, long-form research, short takes on announcements and company-specific studies. Every one of them is about how to think about investing rather than what to buy. Samso News | www.samso.com.au | An Investor Lens on ASX-Listed Companies Samso News is independent research commentary for general information only. Nothing in this article is financial product advice, and it does not take into account any reader's objectives, financial situation or needs. Figures are drawn from public sources believed reliable at the stated dates but are not guaranteed. Market-sensitive numbers change daily. Samso or associated parties may hold positions in, or have commercial arrangements with, companies mentioned. Seek professional advice before making investment decisions. © Samso 2026 · samso.com.au |

Comments